Market Insights Snapshot
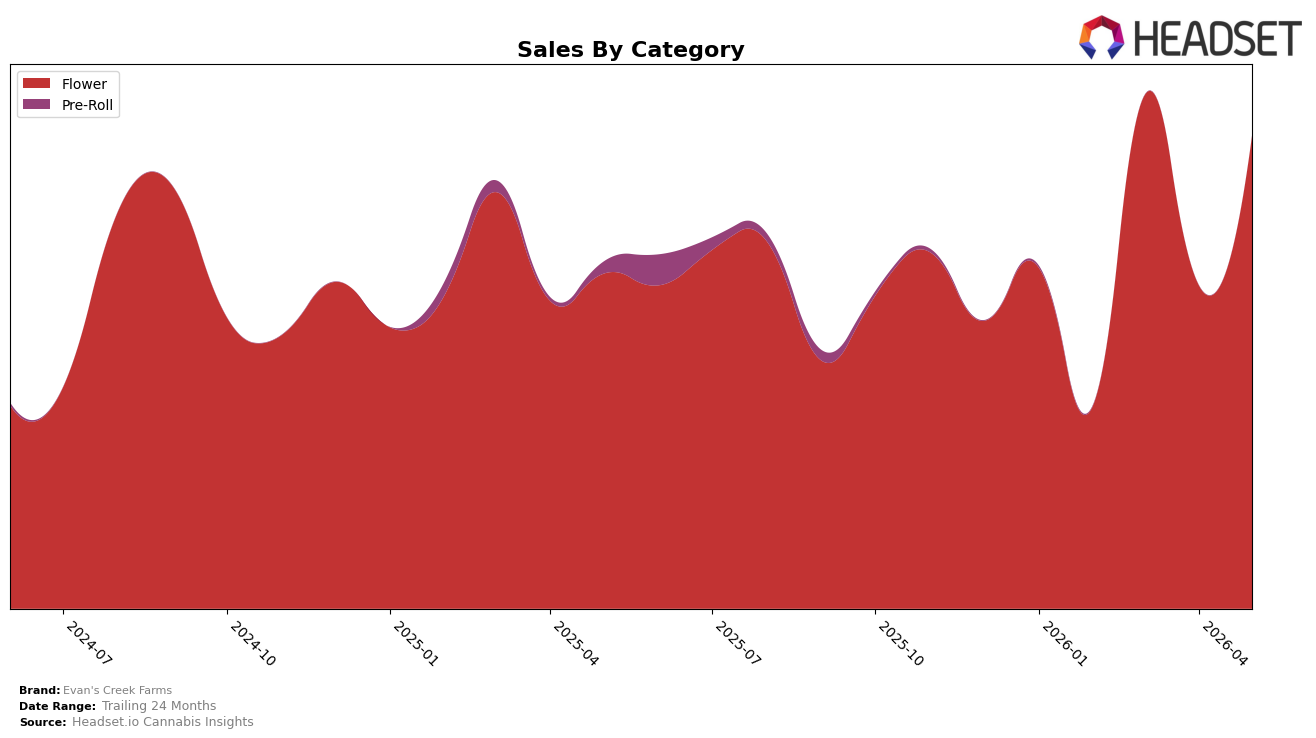
In May 2026, Evan's Creek Farms operated as a single-category brand with Flower at 100.0% mix, rising 41.21% year over year and 46.14% month over month; this coincided with a 16.58% increase in average price to $45.31 and a 36.46% brand-level sales lift year over year. Within Oregon Flower, the brand sat at rank 29 while also posting a 72.05% two-year sales increase, indicating that the May momentum is volume-led beyond price. The pattern implies concentration risk alongside tactical upside: outsized MoM growth at 46.14% versus 16.58% pricing suggests unit acceleration in a single category is driving share capture, but the 100.0% mix leaves no buffer if Flower trends reverse.
The single-category bet positions Evan's Creek Farms as a focused Flower player in Oregon at rank 29, where sustaining share will likely depend on maintaining unit velocity rather than additional pricing, given price rose 16.58% while sales outpaced at 36.46%. With May 2026 MoM growth at 46.14% against a 41.21% YoY Flower gain, recent demand is skewing near-term and could be seasonal, so the brand’s path to higher ranks will hinge on converting this MoM spike into repeat volume or selectively broadening mix from the current 100.0% Flower exposure.
Competitive Landscape
Evan's Creek Farms sits at rank #29 in OR Flower in May 2026, improving 11 positions from #40 year over year and jumping 34 places from #63 in February 2026 to a peak at #29 in May 2026, which signals an acceleration rather than a one-off bump. Meanwhile, PRUF Cultivar / PRŪF Cultivar held at #1 year over year with a 23.9% sales increase, and Grown Rogue climbed from #7 to #2 on 51.1% growth, indicating that Evan's Creek Farms’ upward rank shift coexists with competitors gaining or maintaining top spots; by contrast, Bald Peak eased from #2 to #3 with a 12.6% sales decline, showing room near the top is fluid. The pattern—double-digit rank improvement year over year to a new peak while top peers either advance or soften—implies Evan's Creek Farms is transitioning from middle-tier volatility toward consistent upper-mid-tier contention if it sustains share capture against incumbents posting 20–51% growth.

Notable Products
Fire Belly Toad (7g) delivered the standout move in May 2026 with a 1957.6% month-over-month surge to rank 1, while Pi Chew (Bulk) climbed 185.1% to rank 3, and the top two ranks concentrated in Flower indicate a pivot toward packaged and bulk Flower velocity; with Grandpa's Gun Chest (Bulk) debuting at rank 2, three of the top four are Flower SKUs, pointing to a category concentration among the top ten. The single largest dollar contributor was Fire Belly Toad (7g) at $84,528, and the step-up from rank 3 to rank 1 alongside a 185.1% lift for Pi Chew (Bulk) signals trading up within Flower rather than breadth expansion. The pattern implies Evan's Creek Farms is leaning into Flower-led scale, with momentum anchored by a high-growth 7g SKU complemented by bulk formats, concentrating share capture in fewer, faster-moving items.
Top Selling Cannabis Brands
Data for this report comes from real-time sales reporting by participating cannabis retailers via their point-of-sale systems, which are linked up with Headset’s business intelligence software. Headset’s data is very reliable, as it comes digitally direct from our partner retailers. However, the potential does exist for misreporting in the instance of duplicates, incorrectly classified products, inaccurate entry of products into point-of-sale systems, or even simple human error at the point of purchase. Thus, there is a slight margin of error to consider. Brands listed on this page are ranked in the top twenty within the market and product category by total retail sales volume.

