.svg)


Where to Buy
Midnight Fruit Company is stocked at 71 licensed dispensaries across Oregon, with the deepest coverage in Portland, Eugene, Salem, Bend, and Corvallis. Search by ZIP code or city below to find the closest one, or filter by product type if you are after a specific format.
Market Insights Snapshot
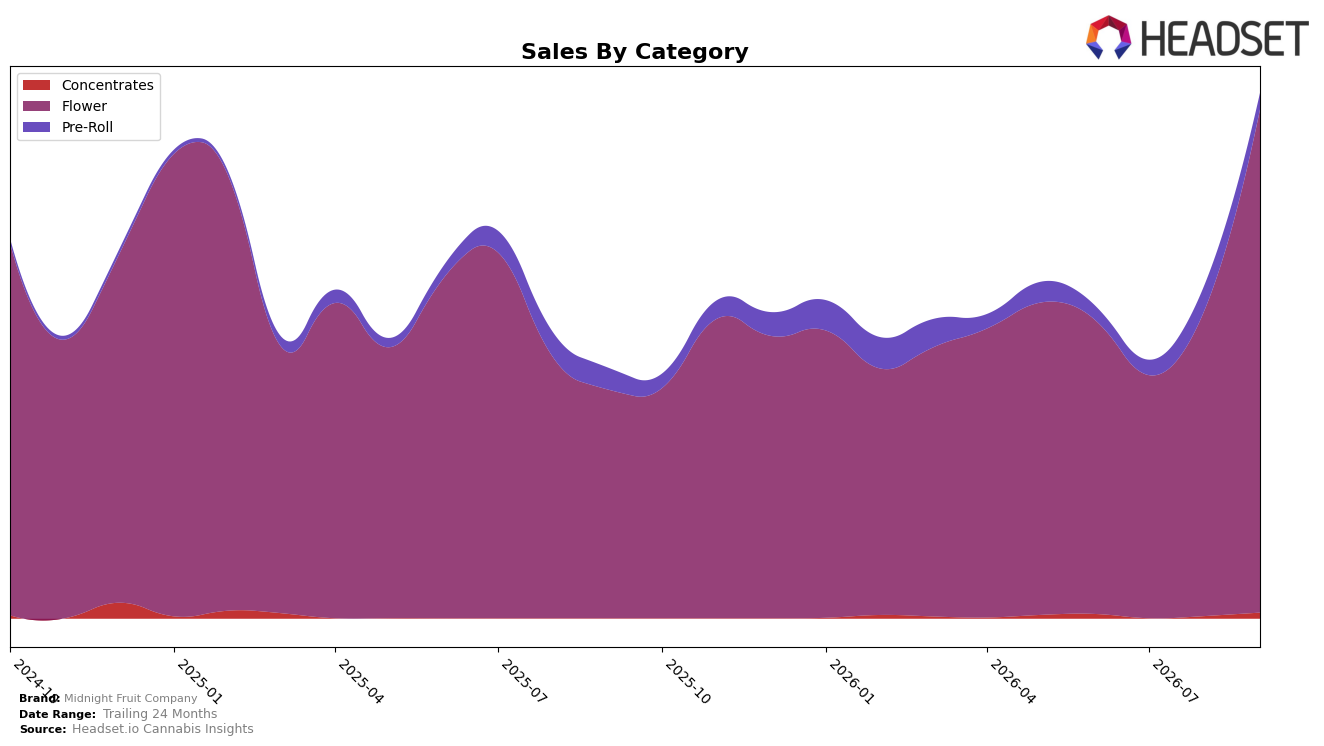
In September 2026, Midnight Fruit Company concentrated 95.87% of sales in Flower, with Flower up 120.36% year over year and 64.47% month over month, while Pre-Roll contracted to a 3.06% share with a -25.29% YoY and -35.78% MoM decline. Concentrates remained a small 1.08% slice but spiked 159.31% MoM off a low base, contrasting with the brand’s overall average price falling 31.44% YoY as Flower’s average price sat at $15.43. The mix tilt boosted total brand sales by 110.10% YoY and lifted Flower’s standing to rank 13 in Oregon, implying the company is trading volume for position via a lower-price Flower strategy while allowing non-Flower lines to shrink in relative importance.
The shift toward low-priced Flower and away from Pre-Roll (down 3.06% share with double-digit declines) suggests Midnight Fruit Company is optimizing for share capture in core Flower rather than breadth, evidenced by a 64.47% MoM surge coincident with a 31.44% YoY price drop. The 159.31% MoM pop in Concentrates at just 1.08% share points to tactical experimentation rather than a scale play, while the rank at 13 in Oregon indicates room to climb if the price-led volume approach continues to convert. Net effect: the brand is positioning as a value-forward Flower specialist, prioritizing velocity and rank gains in Flower over diversified category presence.
Competitive Landscape
Midnight Fruit Company sits at rank #13 in OR Flower in September 2026, improving 18 positions year over year from #31 and jumping 15 places since June 2026 when it was #28; this also marks a peak rank of #13 in September 2026. In contrast, Grown Rogue moved from #3 to #1 with 63.8% YoY sales growth, while Oregrown surged from #16 to #3 on 169.7% YoY sales growth, indicating that category leaders are widening the performance gap even as Midnight Fruit Company rises. The combination of a rapid rank climb (from #31 to #13 YoY) and the concentration of competitors in the top five implies Midnight Fruit Company is breaking into the upper tier but must accelerate share gains to convert momentum into a stable top-10 position.

Notable Products
Hash Burger (Bulk) posted the largest movement in September 2026 with a 153.9% month-over-month surge to $62,591 and climbed to rank 1, while Strawberry Cough (Bulk) plunged 79.2% and fell to rank 10. Sour Candy Lope (Bulk) also expanded 76.0% and held rank 4, whereas Chem Cookies (Bulk) slipped 6.0% at rank 8. Eight of the top ten SKUs are Flower, indicating concentration at the bulk and 3.5g formats with ranks clustered at 1, 2, 3, 4, 5, and 6. The mix implies Midnight Fruit Company is consolidating share in core Flower through aggressive bulk velocity, but volatility at the tail signals a portfolio that prioritizes scale winners over breadth.
Top Selling Cannabis Brands






Data for this report comes from real-time sales reporting by participating cannabis retailers via their point-of-sale systems, which are linked up with Headset’s business intelligence software. Headset’s data is very reliable, as it comes digitally direct from our partner retailers. However, the potential does exist for misreporting in the instance of duplicates, incorrectly classified products, inaccurate entry of products into point-of-sale systems, or even simple human error at the point of purchase. Thus, there is a slight margin of error to consider. Brands listed on this page are ranked in the top twenty within the market and product category by total retail sales volume.

