Nov-2025
Sales
Trend
6-Month
Product Count
SKUs
Avg Price
YoY Sales Change
YoY Price Change
Market Insights Snapshot
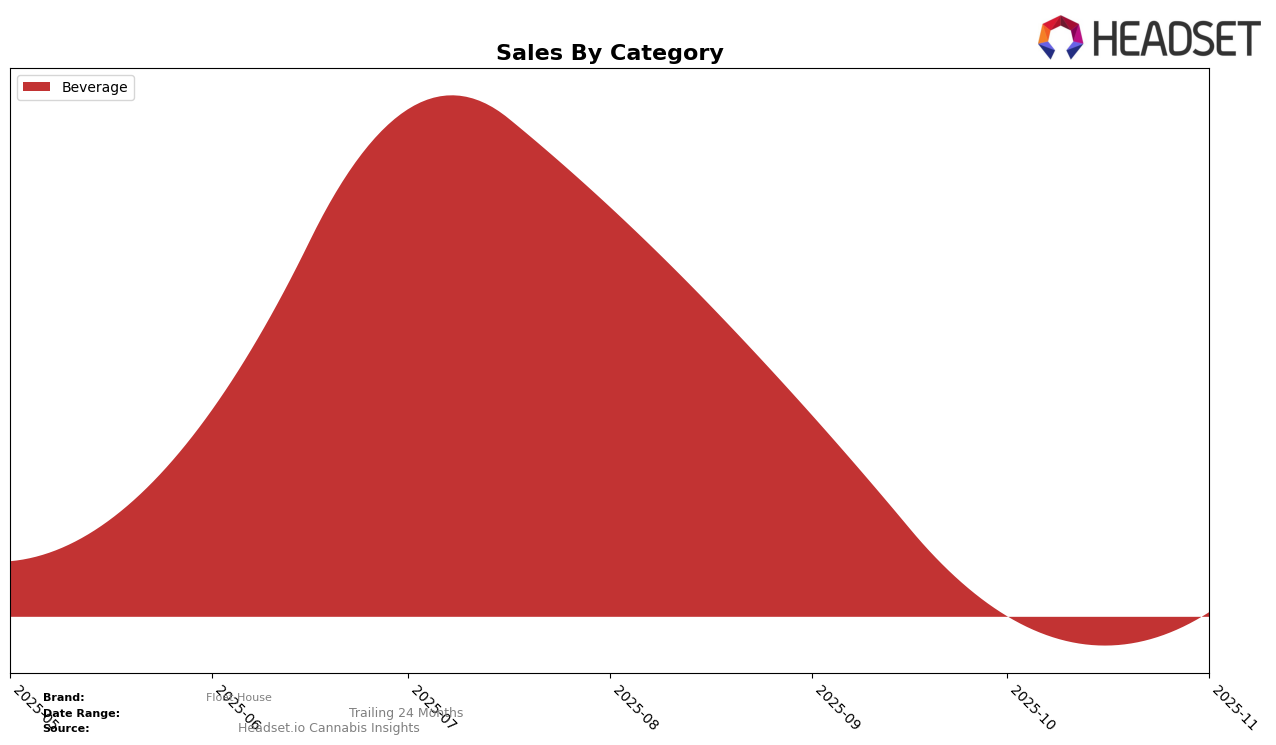
Float House has shown a noteworthy presence in the Beverage category in Connecticut. In August 2025, the brand achieved a commendable rank of 5th, with sales figures reaching $10,385. However, over the subsequent months of September, October, and November, Float House did not maintain its position within the top 30 brands in the state. This absence in the rankings could indicate a decline in market presence or increased competition in the Beverage category within Connecticut. The initial strong performance, followed by a lack of visibility, suggests that while the brand has potential, it may need to reassess its strategy to sustain its market position.
While specific ranking data for other states or provinces is not available, the performance in Connecticut provides insights into Float House's competitive landscape. The fluctuation in rankings highlights the importance of maintaining consistent brand visibility and consumer engagement, especially in a dynamic market. Brands in the cannabis industry often face challenges such as regulatory changes and shifting consumer preferences, which can impact their market standing. Understanding these dynamics is crucial for Float House as it navigates its growth strategy across different regions.
Competitive Landscape
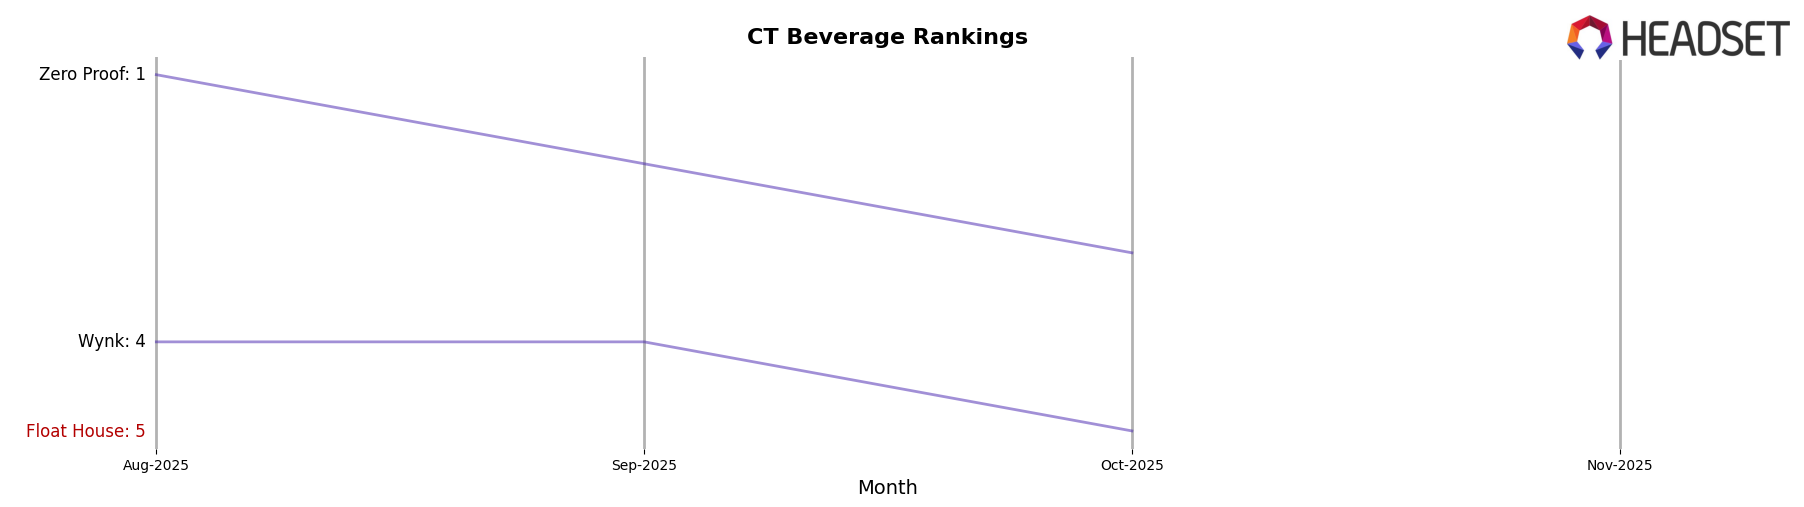
In the Connecticut beverage category, Float House has experienced notable fluctuations in its market presence, particularly when compared to its competitors. As of August 2025, Float House held the 5th rank, but it did not maintain a position in the top 20 in the subsequent months of September, October, and November. This indicates a significant drop in visibility and sales performance. In contrast, Zero Proof maintained a strong position, starting at 1st place in August and only slightly dropping to 3rd by October, showcasing its robust market dominance. Similarly, Wynk remained relatively stable, fluctuating between 4th and 5th place over the same period. These trends suggest that Float House may need to reassess its market strategies to regain its competitive edge and improve its sales trajectory in the Connecticut beverage market.
Notable Products
In November 2025, the top-performing product for Float House was the CBD/THC 2:1 THC IPA Hoppy Brew (6mg CBD, 3mg THC, 12oz, 355ml) within the Beverage category, maintaining its position as the number one ranked product for four consecutive months, with sales reaching 973 units. Following closely, the CBD/THC 2:1 Lite Crisp THC Brew (6mg CBD, 3mg THC, 12oz, 355ml) also remained steady in the second rank throughout the same period. Notably, both products have consistently held their rankings since August 2025, indicating strong and stable consumer preference. Despite a fluctuation in sales figures over the months, the rank stability suggests that these beverages continue to be highly favored in the market. The data highlights the dominance of these two products in the Beverage category for Float House during this period.
Top Selling Cannabis Brands
Data for this report comes from real-time sales reporting by participating cannabis retailers via their point-of-sale systems, which are linked up with Headset’s business intelligence software. Headset’s data is very reliable, as it comes digitally direct from our partner retailers. However, the potential does exist for misreporting in the instance of duplicates, incorrectly classified products, inaccurate entry of products into point-of-sale systems, or even simple human error at the point of purchase. Thus, there is a slight margin of error to consider. Brands listed on this page are ranked in the top twenty within the market and product category by total retail sales volume.

