Jun-2026
Sales
Trend
6-Month
Product Count
SKUs
Avg Price
YoY Sales Change
YoY Price Change
Market Insights Snapshot
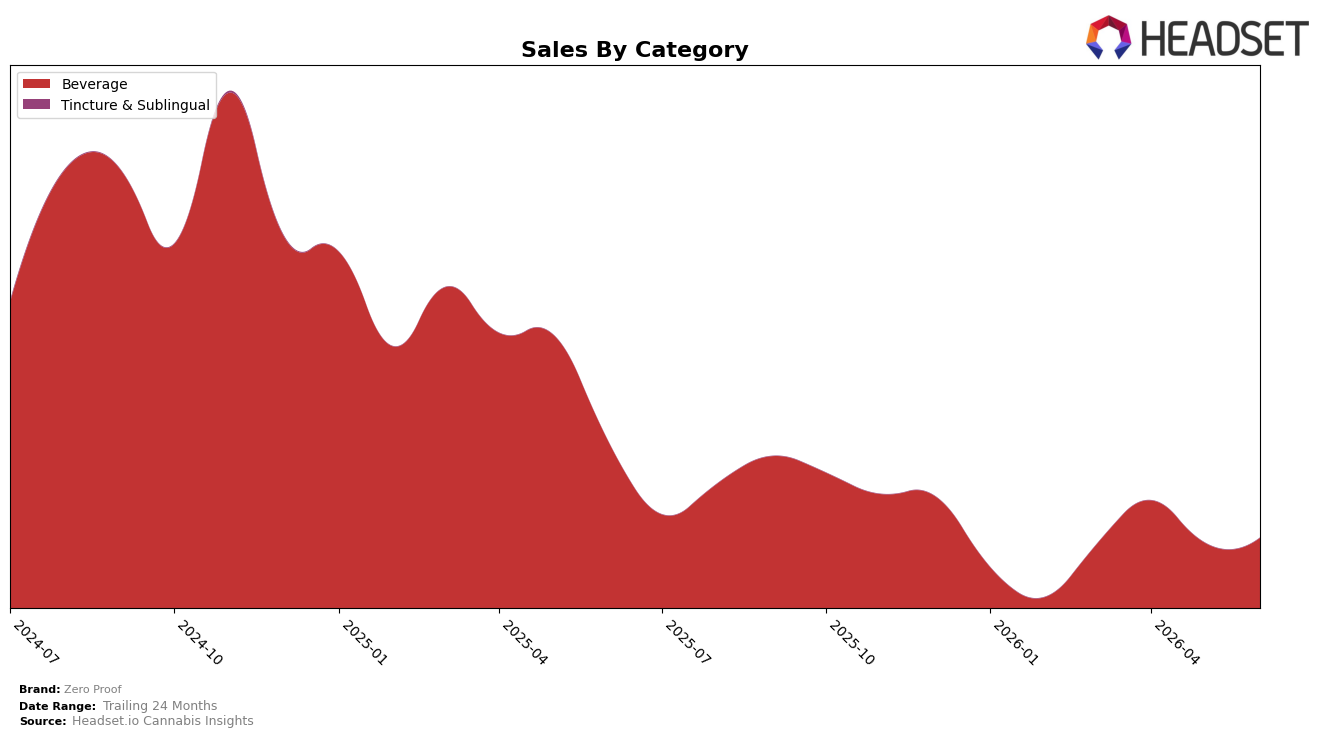
In June 2026, Zero Proof concentrated entirely in Beverage with a 100.0% category share, pairing a year-over-year sales change of -58.1% with a month-over-month increase of 7.4%. Average price dipped by 1.3% year over year to $23.51, while category rank in Beverage in Connecticut held at position 3; that rank context, alongside a 50.8% two-year sales gain, indicates the brand is compressing pace year over year while still outpacing its 24-month baseline.
The shift to a single-category footprint implies Zero Proof is trading breadth for depth: the 7.4% June 2026 month-over-month lift alongside a 100.0% Beverage mix signals reliance on intra-category velocity rather than portfolio diversification, and the -58.1% year-over-year decline paired with a 1.3% price reduction points to volume softness not fully offset by tactical pricing. Holding rank 3 in Connecticut Beverage while average price is down 1.3% suggests competitive positioning anchored in mid-price elasticity, implying that near-term share defense hinges more on sustained June momentum than on further price moves.
Competitive Landscape
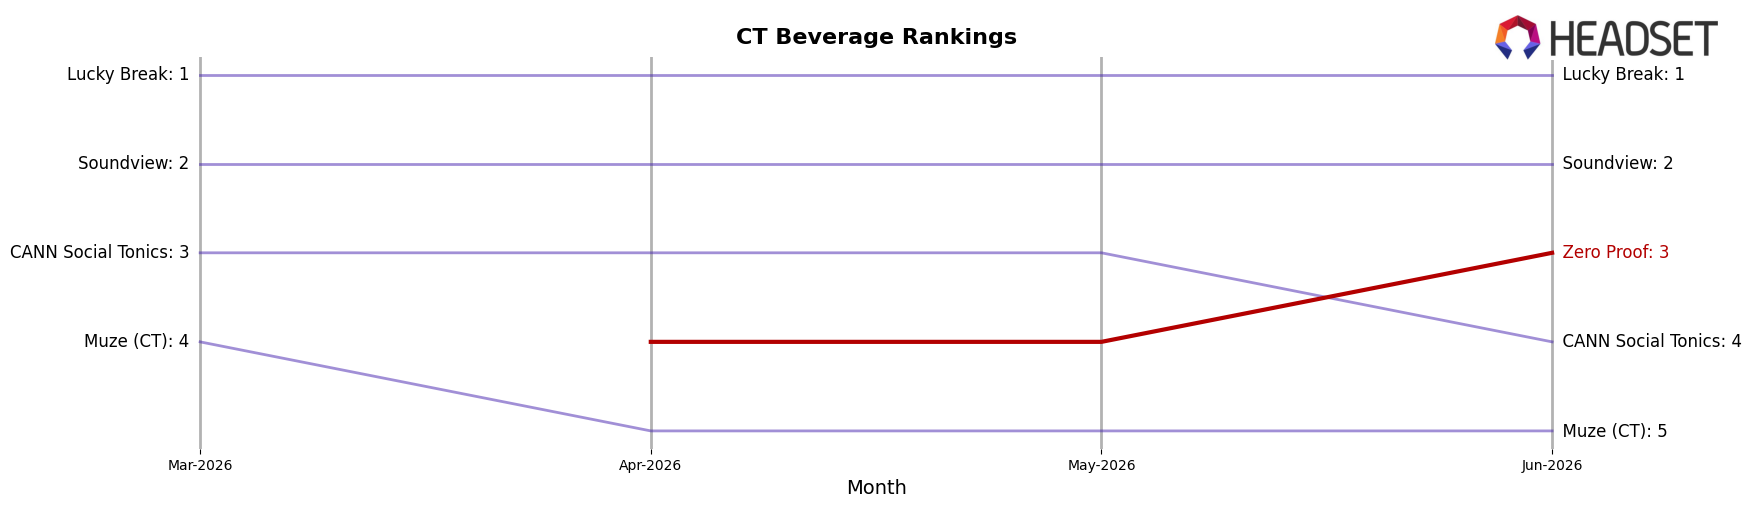
Zero Proof is ranked #3 in CT Beverage in June 2026, up 1 position year over year, and up 2 spots from #5 three months ago, while its historical peak was #1 in August 2025; in contrast, Lucky Break holds #1 with no disclosed year-over-year movement and CANN Social Tonics sits at #4 after a 2-position year-over-year climb alongside a 20.9% sales increase, indicating Zero Proof’s near-term ascent is outpacing the broader mid-tier but still lags the category leader, implying the current rank trajectory points to a realistic bid for #2 if momentum from a 2-rank quarterly gain sustains while guarding against reversion from its August 2025 peak.
Notable Products
Squeeze - Dash of Lime Beverage Enhancer (100mg THC, 40ml) posted the largest month-over-month surge at 179.1% and climbed to rank 4, while Squeeze - Dash of Orange Beverage Enhancer (100mg THC, 40ml) grew 29.6% to hold rank 1. In contrast, Squeeze - Dash of Sweet Beverage Enhancer (100mg THC, 40ml) fell 30.6% at rank 2 as Squeeze - Dash of Cherry Beverage Enhancer (100mg THC, 40ml) advanced 43.9% at rank 3. Four of the top four SKUs are Beverage Enhancers within the Squeeze line, collectively concentrating category share despite a mixed spread of growth rates and one sharp decline. The pattern implies Zero Proof is consolidating around flavor-variety Beverage Enhancers, shifting mix toward faster-velocity flavors and away from lagging sweet profiles.
Top Selling Cannabis Brands
Data for this report comes from real-time sales reporting by participating cannabis retailers via their point-of-sale systems, which are linked up with Headset’s business intelligence software. Headset’s data is very reliable, as it comes digitally direct from our partner retailers. However, the potential does exist for misreporting in the instance of duplicates, incorrectly classified products, inaccurate entry of products into point-of-sale systems, or even simple human error at the point of purchase. Thus, there is a slight margin of error to consider. Brands listed on this page are ranked in the top twenty within the market and product category by total retail sales volume.

