Market Insights Snapshot
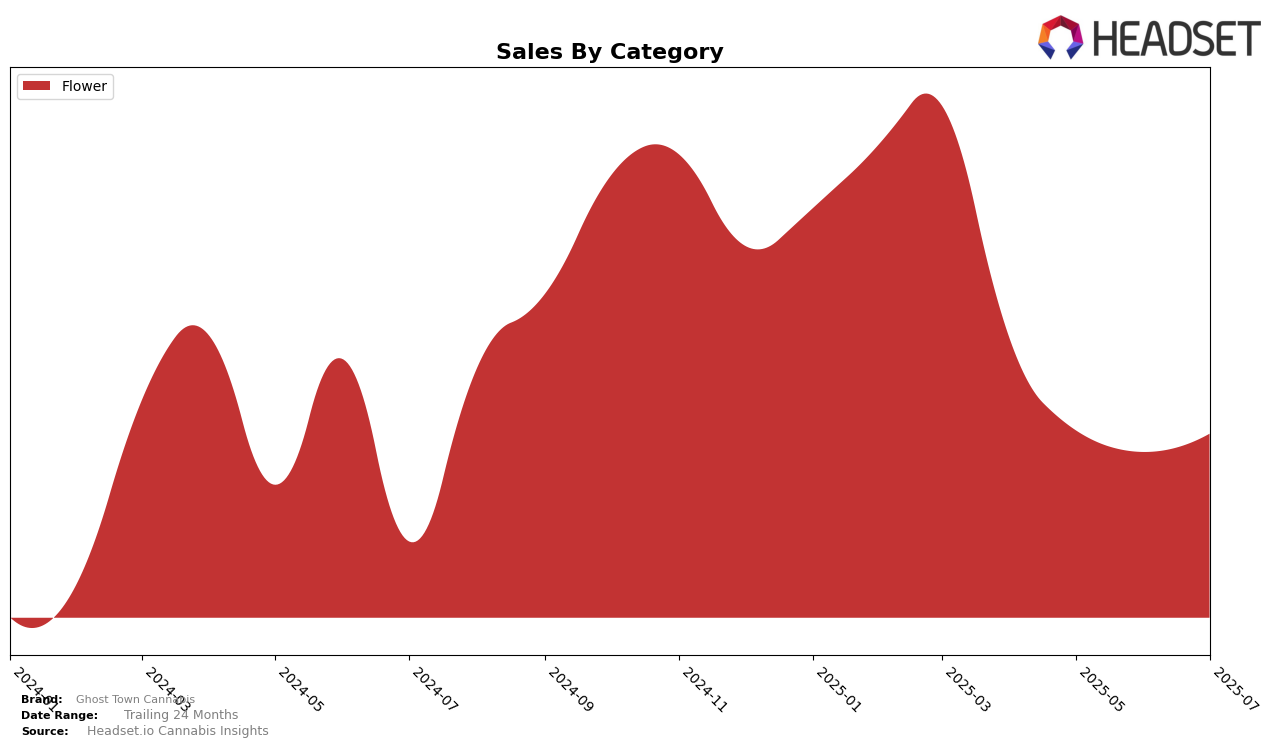
Ghost Town Cannabis has shown varied performance across different states and categories in recent months. In Nevada, the brand has experienced fluctuations in the Flower category, where it ranked 19th in April 2025. However, by June, it slipped to the 30th position, barely maintaining a spot in the top 30. This drop in ranking coincided with a decrease in sales from April to June, indicating potential challenges in maintaining market share. Despite this, July saw a slight recovery in rank to 26th, suggesting a possible stabilization or strategic adjustment in the market approach.
Interestingly, the performance of Ghost Town Cannabis in other states and categories is not highlighted here, which could indicate either a lack of presence or a focus on specific markets like Nevada. The absence from the top 30 in other states or categories might suggest an area for growth or a strategic decision to concentrate efforts in regions where they have established a foothold. Understanding these dynamics could be crucial for stakeholders looking to capitalize on emerging trends or to identify areas for expansion. The brand's ability to recover in Nevada may serve as a case study for potential strategies in other markets.
Competitive Landscape
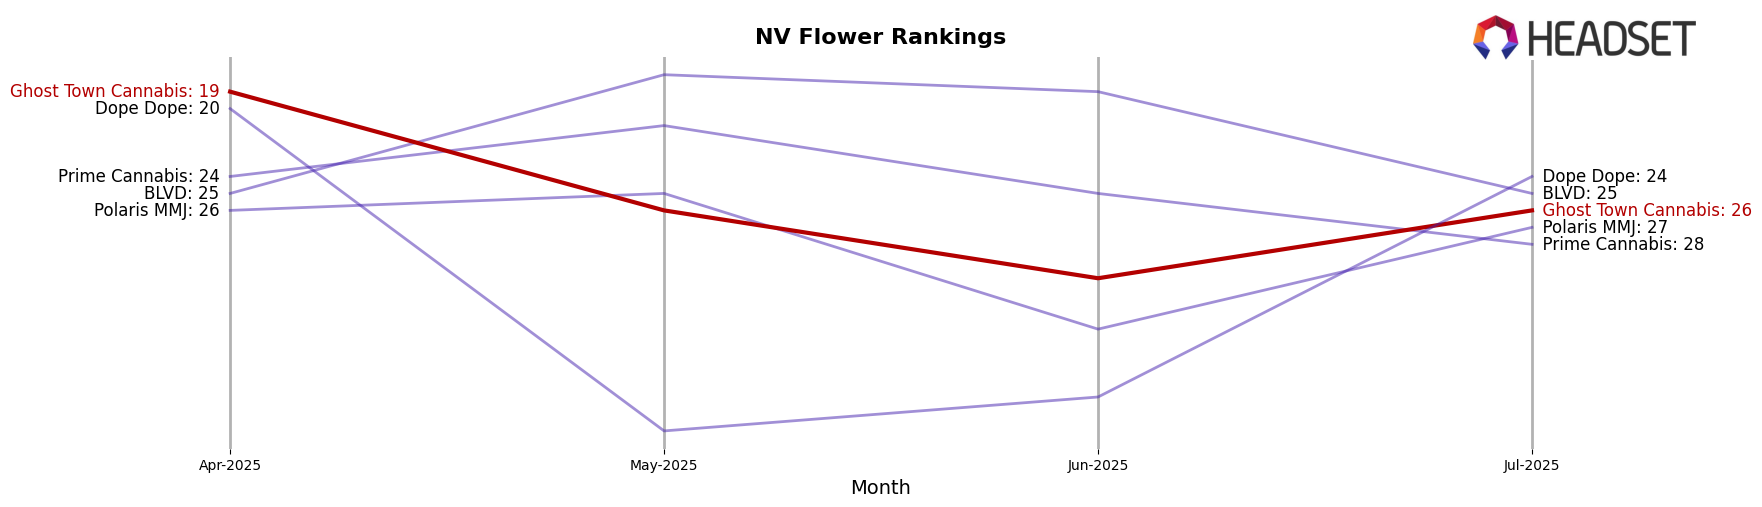
In the competitive landscape of the Flower category in Nevada, Ghost Town Cannabis has experienced fluctuations in its ranking over the months from April to July 2025, indicating a dynamic market presence. Starting in April, Ghost Town Cannabis was ranked 19th but saw a decline to 26th in May and further to 30th in June, before slightly recovering to 26th in July. This downward trend in rank correlates with a decrease in sales, suggesting challenges in maintaining market share. Competitors like BLVD have shown a more stable and improving trajectory, moving from 25th in April to 18th in May and maintaining a strong position through June, which could be a contributing factor to Ghost Town Cannabis's struggles. Meanwhile, Dope Dope demonstrated a significant rebound from 39th in May to 24th in July, potentially capturing market interest that Ghost Town Cannabis might have lost. These competitive dynamics highlight the need for Ghost Town Cannabis to innovate and strategize effectively to regain its footing in the Nevada Flower market.
Notable Products
In July 2025, the top-performing product for Ghost Town Cannabis was Peanut Butter Breath (3.5g) in the Flower category, maintaining its number one rank consistently since April, with an impressive sales figure of 4948 units. Lemon Party (3.5g), also in the Flower category, secured the second position, improving from its previous fifth rank in April and achieving a notable increase in sales. Wook Stomper (3.5g) climbed to third place after debuting at fourth in June. Blue Zushi (3.5g) entered the rankings at fourth place, having previously been second in May. Drops of Jupiter (3.5g) saw a decline, dropping to fifth position from its previous third place in April and June.
Top Selling Cannabis Brands
Data for this report comes from real-time sales reporting by participating cannabis retailers via their point-of-sale systems, which are linked up with Headset’s business intelligence software. Headset’s data is very reliable, as it comes digitally direct from our partner retailers. However, the potential does exist for misreporting in the instance of duplicates, incorrectly classified products, inaccurate entry of products into point-of-sale systems, or even simple human error at the point of purchase. Thus, there is a slight margin of error to consider. Brands listed on this page are ranked in the top twenty within the market and product category by total retail sales volume.

