.svg)


Where to Buy
BLVD is stocked at 60 licensed dispensaries across Nevada, with the deepest coverage in Las Vegas, Henderson, Reno, North Las Vegas, and Carson City. Search by ZIP code or city below to find the closest one, or filter by product type if you are after a specific format.
Market Insights Snapshot
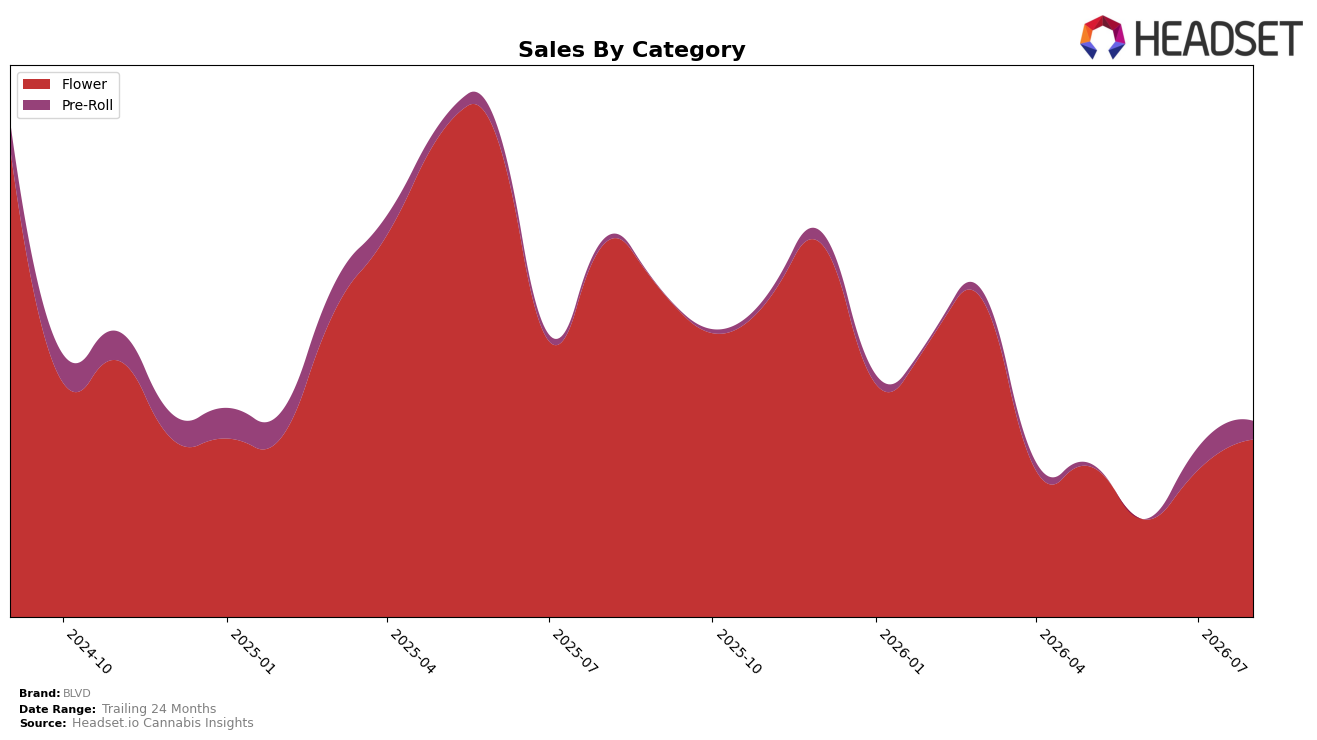
In August 2026, BLVD concentrated 89.90% of sales in Flower while Pre-Roll held 10.10%, a mix that tightened around Flower despite divergent growth rates. Flower sales were down 52.22% year over year but up 20.65% month over month, while Pre-Roll rose 204.98% year over year but fell 16.92% month over month; this combination implies the brand leaned into a short-term Flower recovery while still contending with deep annual contraction. The average price declined 9.74% year over year to $28.46, and Flower’s unit economics skewed higher at an average price of 33.79 versus 11.83 for Pre-Roll, indicating that mix shifts toward Flower can lift revenue per unit even as total brand sales fell 47.77% year over year.
Positionally, BLVD’s Flower rank at 34 in Nevada suggests headroom if the 20.65% month-over-month Flower gain continues, but the 52.22% year-over-year Flower decline sets a lower baseline that limits near-term share capture. The 204.98% year-over-year surge in Pre-Roll from a 10.10% share base, paired with a 16.92% month-over-month pullback, signals volatility that can complement Flower without redefining the brand’s center of gravity; the implication is that BLVD’s quickest path to stabilizing rank is incremental Flower momentum while using selective Pre-Roll pushes to buffer demand dips.
Competitive Landscape
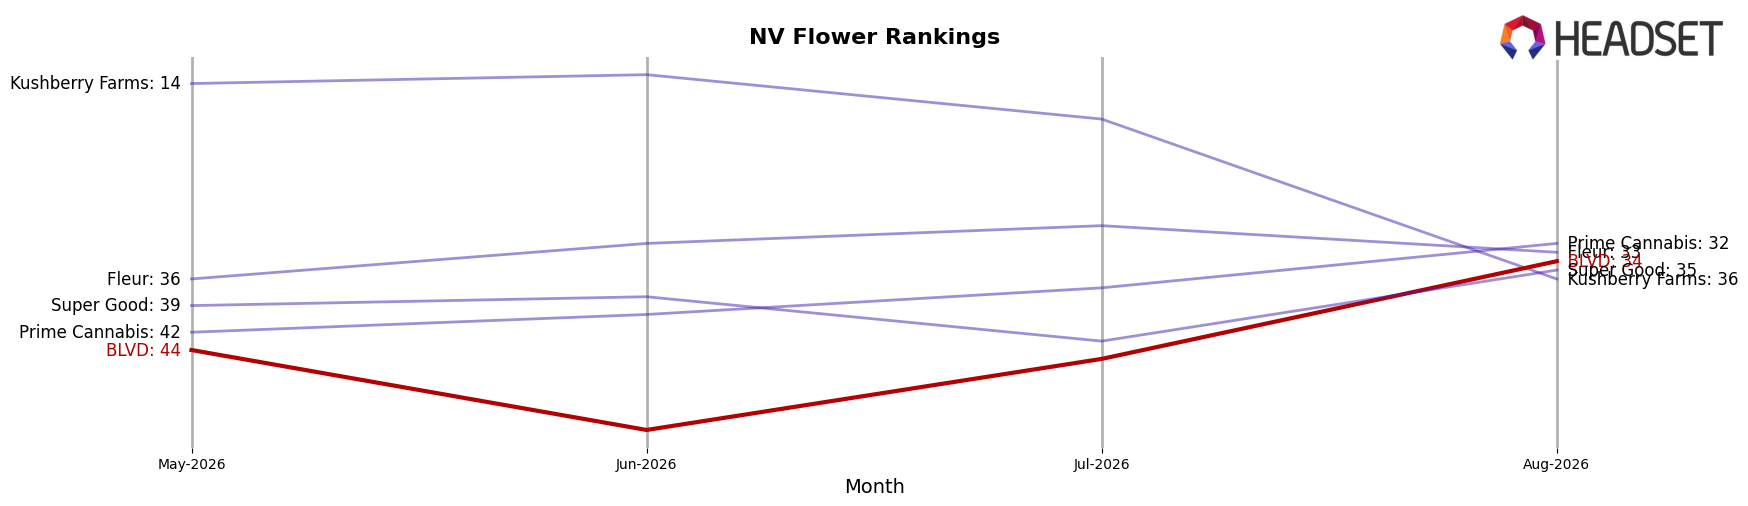
BLVD is ranked #34 in Nevada Flower in August 2026, down 10 positions year over year from #24, and it improved 10 ranks since May 2026 when it sat at #44. Against top competitors, STIIIZY advanced from #2 to #1 while growing sales 50.5%, and Neon Moon surged from #13 to #3 alongside a 159.5% sales increase; by contrast, Good Green held at #4 with a -16.8% sales change. BLVD’s current #34 versus its #18 peak in June 2025, together with a recent 10-rank climb since May 2026, implies a recovery phase where share can be regained if the upward momentum outpaces leaders’ double- and triple-digit gains.
Notable Products
Funkfetti (3.5g) delivered the standout move with a 425.3% month-over-month gain to rank 5, while Naked City Gushers Pre-Roll (1g) fell 87.1% to rank 10, indicating volatility at the fringes of the lineup. 702 Headband (3.5g) rose 79.4% to rank 1 and Cap Junkie (3.5g) declined 40.7% to rank 3, with Flower SKUs occupying six of the top ten and concentrating momentum in eighths rather than in Pre-Rolls. Cap Junkie Pre-Roll (1g) advanced 62.5% to rank 2 even as 702 Headband Pre-Roll (1g) slid 30.4% to rank 7, creating divergence within format pairs and pointing to strain-level rather than form-factor effects. The pattern implies BLVD’s commercial direction is tilting toward a Flower-led portfolio with selective Pre-Roll support, prioritizing winners like 702 Headband (3.5g) while pruning underperforming pre-roll extensions.
Top Selling Cannabis Brands






Data for this report comes from real-time sales reporting by participating cannabis retailers via their point-of-sale systems, which are linked up with Headset’s business intelligence software. Headset’s data is very reliable, as it comes digitally direct from our partner retailers. However, the potential does exist for misreporting in the instance of duplicates, incorrectly classified products, inaccurate entry of products into point-of-sale systems, or even simple human error at the point of purchase. Thus, there is a slight margin of error to consider. Brands listed on this page are ranked in the top twenty within the market and product category by total retail sales volume.

