Market Insights Snapshot
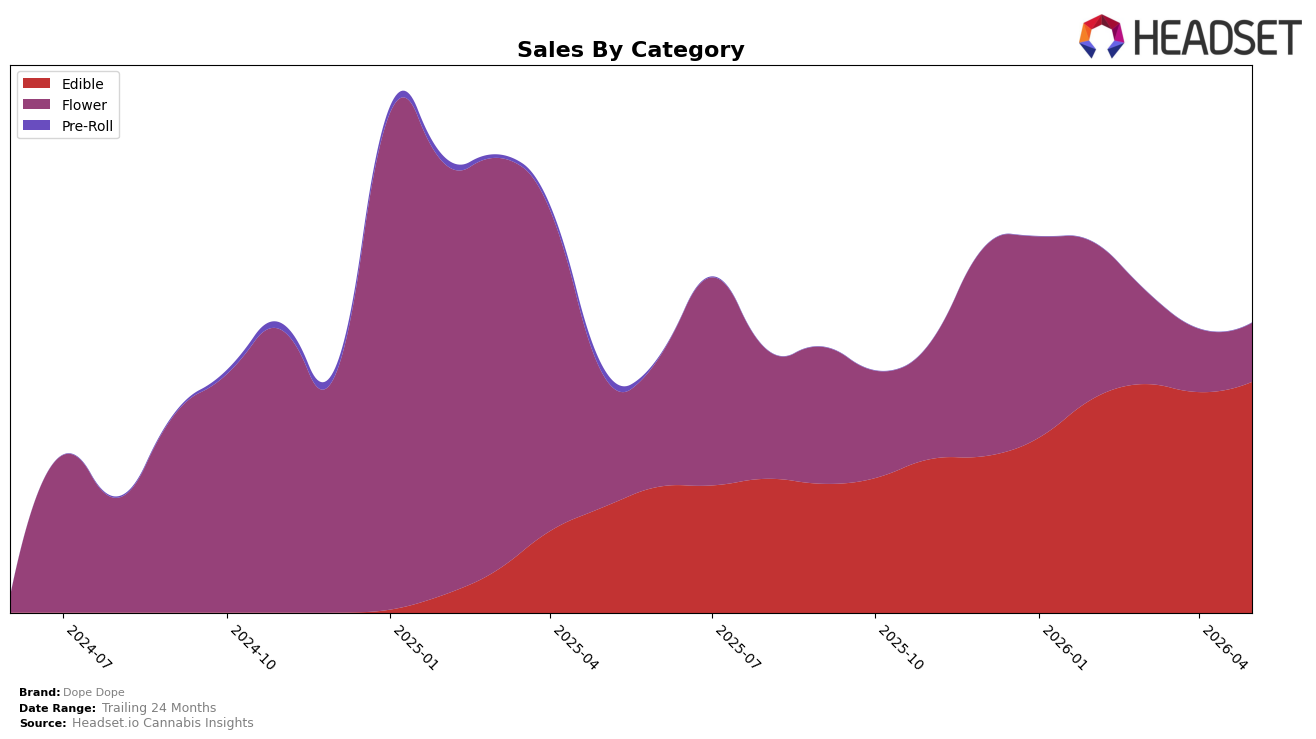
Dope Dope’s category mix in May 2026 skewed toward Edible at 79.76% share (ranked 30th in Edible within Michigan), with Flower at 20.24% share; Edible sales grew 118.55% year over year and 4.63% month over month, while Flower declined 55.38% year over year and 6.91% month over month. Against this backdrop, overall brand sales rose 18.68% year over year even as the average price fell 38.93% year over year to $3.42, indicating volume expansion concentrated in Edible while Flower contracted.
The shift implies a deliberate push toward lower-price, higher-velocity Edible units—Edible average price at $2.78 versus Flower at $35.67—supporting share gains in Edible (up to 79.76%) while Flower’s 6.91% month-over-month decline reduced diversification. With May 2026 Edible growth at 4.63% month over month alongside a 55.38% year-over-year decline in Flower, the mix tilts Dope Dope’s positioning toward value-driven Edibles where a 30th place rank in Michigan can improve via continued price-volume tradeoffs, but reliance on one category raises exposure if Edible momentum slows.
Competitive Landscape
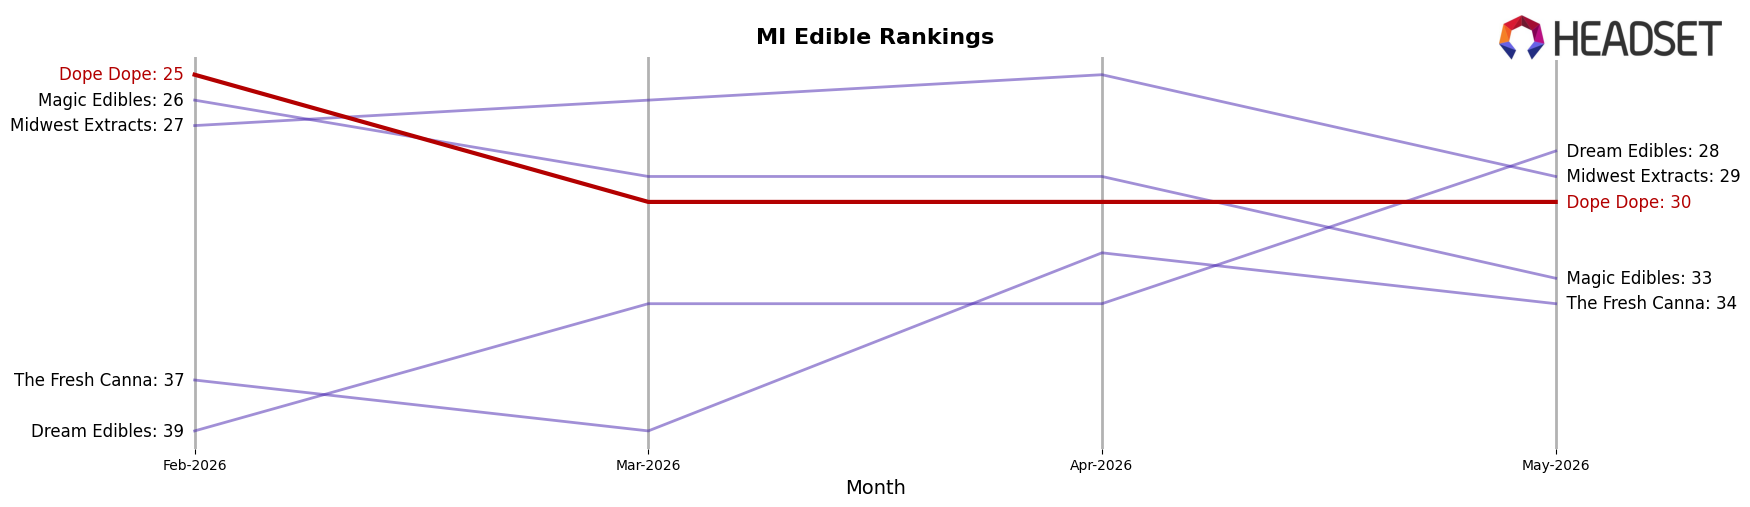
Dope Dope sits at rank #30 in MI Edible in May 2026, improving 25 positions from #55 year over year, but sliding 5 spots from #25 in February 2026 to #30 by May 2026; this mix of a 25-rank YoY climb and a 5-rank decline versus its three-month peak signals momentum that has recently cooled. Against category leaders, Wyld held #1 year over year while its sales declined 17.0%, and Choice stayed at #2 with a 1.0% sales dip, suggesting headroom for share shifts even without rank churn; meanwhile, Camino climbed from #5 to #4 on 13.9% sales growth and Good Tide slipped from #4 to #5 with a 20.3% sales decline, indicating that mid-top-tier positions are in flux. The pattern implies Dope Dope’s upward YoY rank trajectory is real but now depends on converting competitor softness into immediate gains to avoid settling into the high-20s/low-30s band.
Notable Products
Grape Trip Gummy (200mg) posted the standout move in May 2026 with a 130.3% month-over-month surge to $13,713, while Wacky Watermelon Gummy (200mg) slid 10.8% and held rank 2 behind Strawberry Banger Gummy (200mg) at rank 1 with a 3.5% decline. Magic Mimosa Gummy (200mg) advanced 17.9% at rank 3, and four of the top ten are Edible SKUs concentrated in ranks 1–6, indicating the core velocity is clustered at the top while mid-pack gummies are starting to bifurcate between rebounders and decliners. The Flower set shows mixed traction with Wedding Pie (14g) up 47.9% at rank 8 versus Grapes and Cream (14g) down 5.3% at rank 9, implying Flower is adding breadth but not yet disrupting Edibles’ rank dominance. The pattern suggests Dope Dope is leaning into Edibles-led share defense while selectively scaling one or two Flower formats to diversify without diluting the Edible lead.
Top Selling Cannabis Brands
Data for this report comes from real-time sales reporting by participating cannabis retailers via their point-of-sale systems, which are linked up with Headset’s business intelligence software. Headset’s data is very reliable, as it comes digitally direct from our partner retailers. However, the potential does exist for misreporting in the instance of duplicates, incorrectly classified products, inaccurate entry of products into point-of-sale systems, or even simple human error at the point of purchase. Thus, there is a slight margin of error to consider. Brands listed on this page are ranked in the top twenty within the market and product category by total retail sales volume.

