Sep-2025
Sales
Trend
6-Month
Product Count
SKUs
Avg Price
YoY Sales Change
YoY Price Change
Market Insights Snapshot
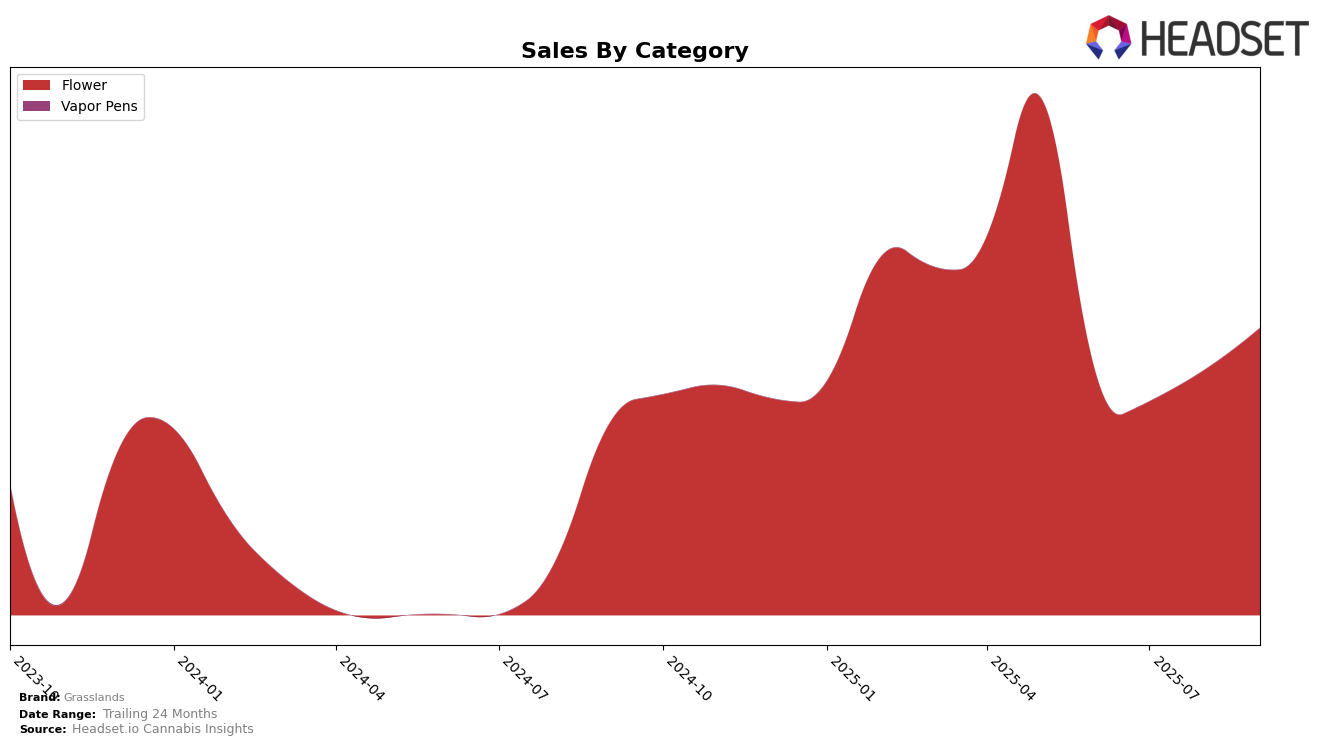
Grasslands has shown a mixed performance across different Canadian provinces and categories. In Alberta, the brand's presence in the Flower category was absent from the top 30 in June, but it made notable progress by ranking 98th in July and climbing to 78th by September. This upward trend suggests a growing acceptance and market penetration in Alberta, although the brand still has a considerable way to go to reach the top tier. The sales in Alberta increased from 25,083 CAD in July to 38,513 CAD in August before slightly dropping to 32,394 CAD in September, indicating some volatility but overall positive growth in consumer interest.
In contrast, Grasslands has maintained a more stable position in the Flower category within British Columbia. The brand consistently ranked within the top 20, starting at 17th in June and improving to 16th by September. This steady performance highlights Grasslands' strong foothold in British Columbia's competitive market. The sales figures reflect this stability, with a notable increase from 278,357 CAD in July to 375,529 CAD in September, suggesting robust demand and effective market strategies. The consistent ranking indicates that Grasslands is a well-recognized brand in British Columbia, though the reasons behind its contrasting performances across provinces could be worth exploring further.
Competitive Landscape
In the competitive landscape of the Flower category in British Columbia, Grasslands has experienced notable fluctuations in its rank over the past few months. Starting at 17th place in June 2025, Grasslands dropped to 19th in July but managed to recover to 16th by September. This recovery is significant, especially when compared to competitors like 1964 Supply Co, which improved from 18th to 15th, and Tweed, which saw a decline from 13th to 17th. Despite the competitive pressure, Grasslands' sales have shown a positive trend, particularly in September, where they outperformed Palmetto, which remained in the lower ranks. The data indicates a resilient performance by Grasslands, suggesting a potential for further growth if the upward trend continues.

Notable Products
In September 2025, Grasslands' top-performing product was Indica (28g) from the Flower category, maintaining its number one rank from the previous two months with a notable sales figure of 3,524 units. Sativa (28g), also in the Flower category, held the second position, showing a consistent performance since July 2025. Indica (28g) has shown a steady increase in sales from June to September, while Sativa (28g) experienced a slight rebound in September after a dip in sales during August. Both products have been dominant in their category, with Indica (28g) overtaking Sativa (28g) in July 2025. The consistent top rankings of these products highlight their popularity and strong market presence for Grasslands.
```Top Selling Cannabis Brands
Data for this report comes from real-time sales reporting by participating cannabis retailers via their point-of-sale systems, which are linked up with Headset’s business intelligence software. Headset’s data is very reliable, as it comes digitally direct from our partner retailers. However, the potential does exist for misreporting in the instance of duplicates, incorrectly classified products, inaccurate entry of products into point-of-sale systems, or even simple human error at the point of purchase. Thus, there is a slight margin of error to consider. Brands listed on this page are ranked in the top twenty within the market and product category by total retail sales volume.

