Jun-2026
Sales
Trend
6-Month
Product Count
SKUs
Avg Price
YoY Sales Change
YoY Price Change
Market Insights Snapshot
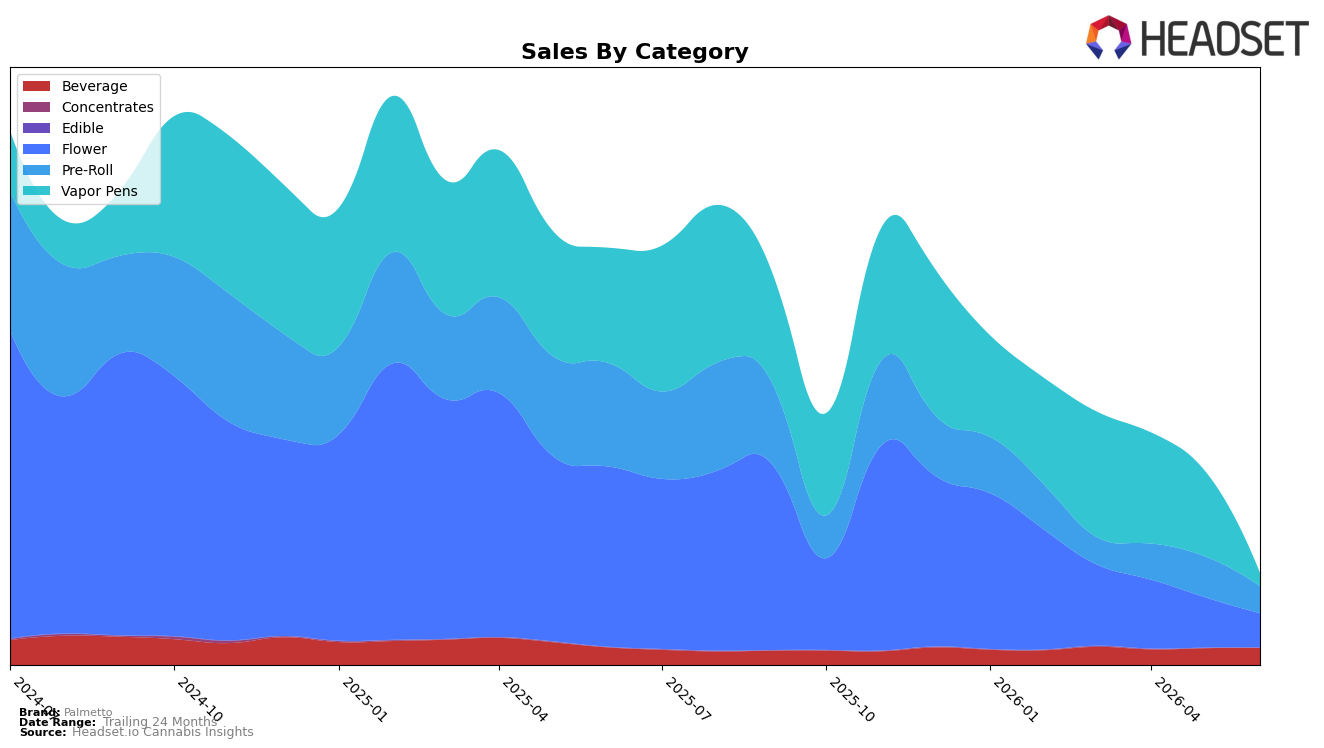
Palmetto’s category mix in June 2026 is concentrated in Flower at 37.55% share (rank 70 in British Columbia), followed by Pre-Roll at 29.54% and Beverage at 18.49%, with Vapor Pens at 14.42%. Year over year, Flower fell 81.14% and Pre-Roll declined 74.14%, while Beverage slipped only 3.33%; month over month, Flower dropped 32.43% and Pre-Roll declined 34.18% as Beverage grew 1.43%. Vapor Pens contracted 88.67% YoY and 84.75% MoM, aligning with an overall average price decline of 44.73% YoY to $17.39. The pattern implies a pivot away from inhalables—where share remains largest but is shrinking—toward a relatively steadier Beverage base that is cushioning total share despite broad volume pressure.
The simultaneous 32.43% MoM retreat in Flower and 34.18% MoM in Pre-Roll, contrasted with a 1.43% MoM gain in Beverage and only a 3.33% YoY Beverage dip, signals short-term resilience in ingestibles versus rapid erosion in inhalables. With Flower still at 37.55% share but carrying an 81.14% YoY decline and a rank of 70 in British Columbia, Palmetto’s positioning leans on a weakening core while a sub-20% Beverage share offers comparatively stable contribution. The implication is that sustaining performance will require either arresting the inhalable slide—particularly the 88.67% YoY and 84.75% MoM collapse in Vapor Pens—or reweighting toward categories like Beverage where volatility is lower and small MoM gains can compound.
Competitive Landscape
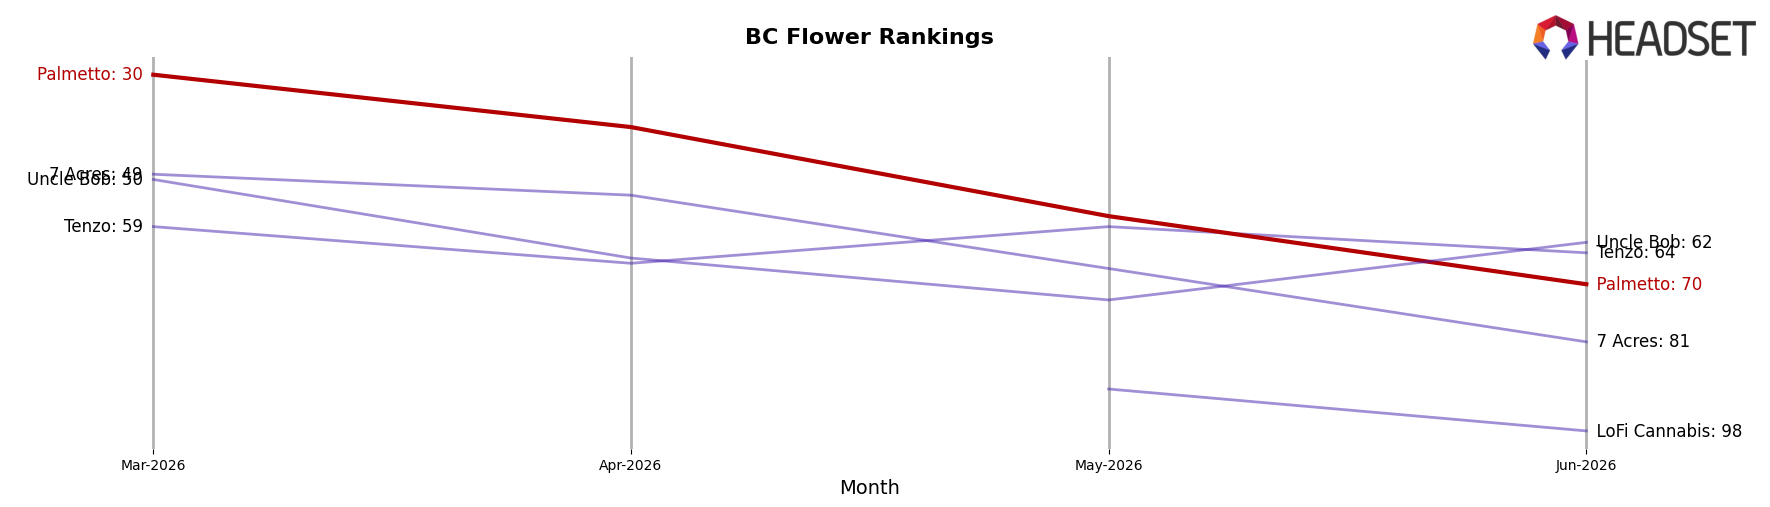
Palmetto is ranked #70 in BC Flower in June 2026, down 49 positions year over year from #21, and down 40 places versus March 2026 when it sat at #30; its historical peak was #13 in July 2024, marking a 57-rank slide from peak to current. While Palmetto moved down, Good Supply climbed from #6 to #1 with a 78% year-over-year sales increase and Spinach advanced from #11 to #3 with an 85% lift, indicating that gains at the top coincide with Palmetto’s displacement in the middle ranks. In contrast, Bake Sale moved up from #8 to #5 despite an 8% year-over-year sales decline, suggesting that relative share shifts rather than category expansion are driving reorder priorities. The pattern implies Palmetto’s trajectory is one of share cession to faster-advancing leaders, and absent a reversal in rank momentum the brand risks further relegation from consideration sets where buyers concentrate on top-5 movers.
Notable Products
Strawberry & Kiwi 3-in-1 Distillate Disposable (1g) posted the steepest decline in June 2026 at -86.37% MoM while falling to rank 5, and Peach & Lemonade Distillate 3-in-1 Disposable (1g) also slid -64.91% MoM at rank 6. In contrast, Orange Vanilla Cream Soda (10mg THC, 355ml) surged +142.60% MoM to rank 1 with $43,742 in sales. With three Vapor Pens in the top ten all down between -64.91% and -86.37%, the category is ceding share as the lead Beverage gains rank leadership, implying a pivot toward non-inhalable demand concentration.
Pre-Roll volatility is visible with Pals - Orange Bud Pre-Roll 10-Pack (4g) dropping -67.70% MoM at rank 3 and Pals - Apple Jack Pre-Roll 10-Pack (4g) down -76.89% MoM at rank 7, while PALS - Blue Cheese Pre-Roll 10-Pack (4g) held closer at -2.74% MoM in rank 4. Flower weakened as Apple Jack (28g) declined -48.94% MoM at rank 8. The mix points to an assortment reset where steady Pre-Roll SKUs can anchor share but growth is currently being pulled by a single Beverage, indicating merchandising and supply should follow the Beverage-led traffic driver.
Top Selling Cannabis Brands
Data for this report comes from real-time sales reporting by participating cannabis retailers via their point-of-sale systems, which are linked up with Headset’s business intelligence software. Headset’s data is very reliable, as it comes digitally direct from our partner retailers. However, the potential does exist for misreporting in the instance of duplicates, incorrectly classified products, inaccurate entry of products into point-of-sale systems, or even simple human error at the point of purchase. Thus, there is a slight margin of error to consider. Brands listed on this page are ranked in the top twenty within the market and product category by total retail sales volume.

