Jun-2026
Sales
Trend
6-Month
Product Count
SKUs
Avg Price
YoY Sales Change
YoY Price Change
Market Insights Snapshot
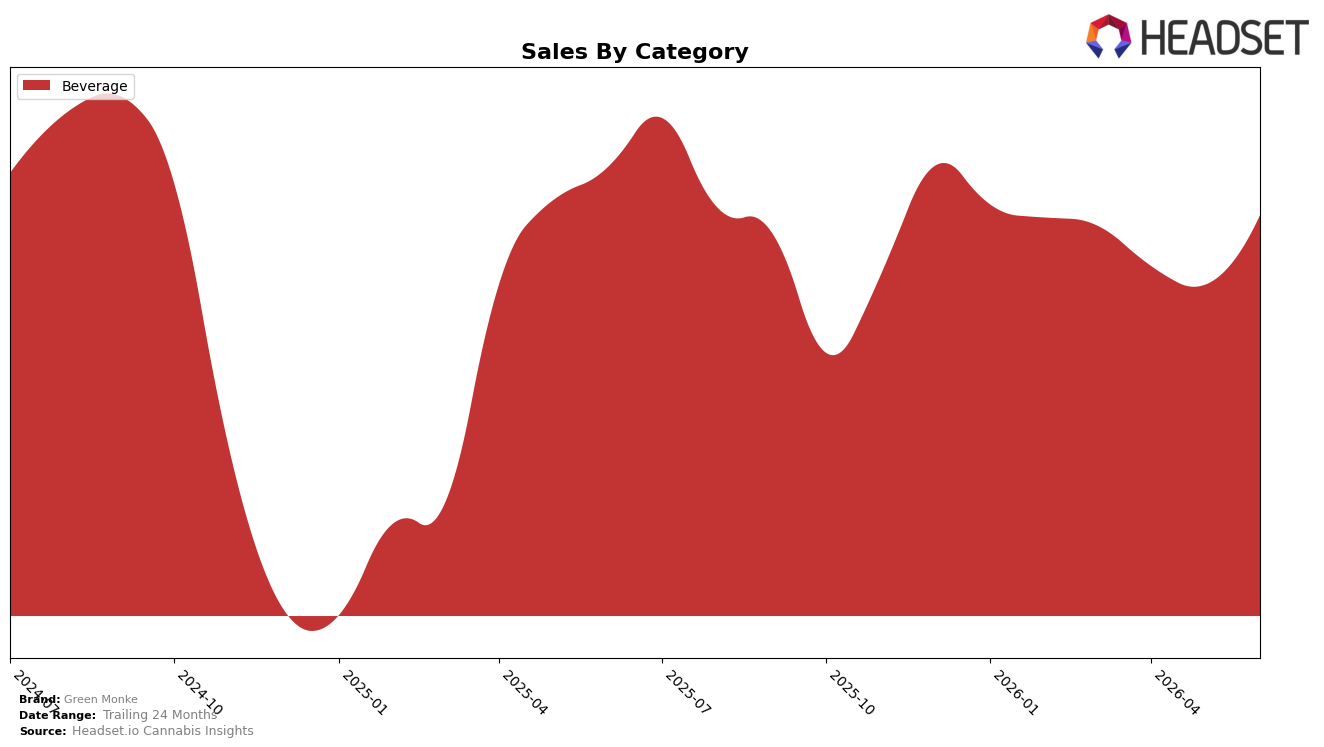
In June 2026, Green Monke operated as a single-category brand with Beverage at 100.0% of sales, posting a year-over-year change of -8.72% and a month-over-month increase of 15.95%, while average price declined 5.60% YoY alongside a 100.0% category share concentration. With rank 9 in Beverage in British Columbia and Ontario as the top-performing province by sales, the combination of a double-digit MoM uptick and a YoY pullback signals a rebound driven more by volume than price as the category mix remains fully concentrated.
The mix staying at 100.0% Beverage, together with a -5.60% YoY price move and a 15.95% MoM sales lift in June 2026, implies that Green Monke’s current positioning leans into accessibility to recover throughput rather than premiumization, and the rank 9 placement in Beverage in British Columbia frames the near-term objective as share maintenance over share expansion. Given -8.72% YoY sales against a -3.91% two-year trajectory, the path forward points to reinforcing core Beverage velocity in Ontario while using tactical pricing to convert MoM momentum into sustained rank gains within provincial Beverage ladders.
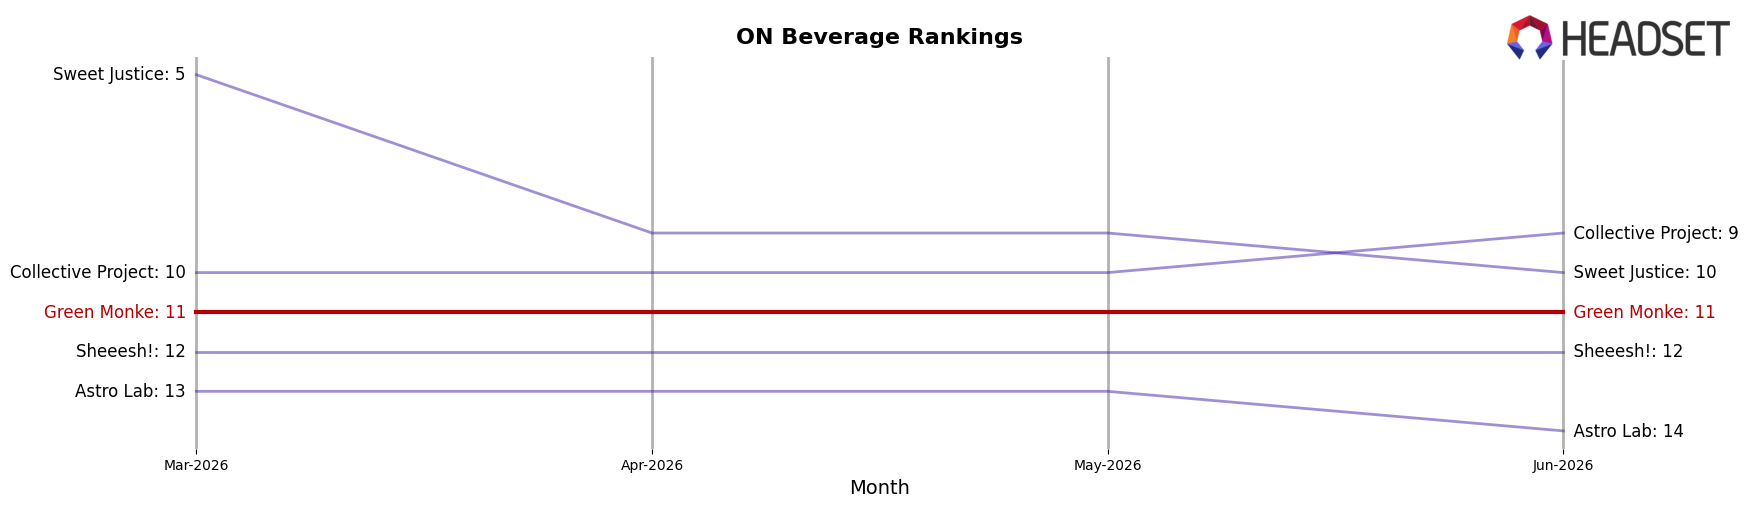
Competitive Landscape
Green Monke sits at #11 in ON Beverage in June 2026, unchanged year over year from #11, with its peak at #9 in October 2024 indicating a two-position slide from that high; meanwhile, XMG held #1 year over year at #1 despite a 36.99% YoY sales decline, and TeaPot climbed from #10 to #5 on 129.54% YoY growth, while Mollo improved from #4 to #3 as Ray's Lemonade rose from #5 to #4 with 23.46% YoY growth; the flat #11 ranking across the past year and past three months, alongside competitors moving up multiple ranks, implies Green Monke’s current positioning risks entrenchment unless it can re-accelerate relative growth.
Notable Products
CBD/THC 2:1 Tropical Citrus Sparkling Soda (10mg CBD, 5mg THC, 11.8oz, 349ml) posted the largest month-over-month gain at 96.8% while moving into rank 8, whereas CBD/THC 2:1 Mango Guava Sparking Soda (6mg CBD, 3mg THC, 350ml) rose 43.1% to rank 1 with $37,359 in June 2026 sales. At the same time, Cookies X Green Monké - CBD/THC 2:1 Hawaiian Rain Sparking Soda (6mg CBD, 3mg THC, 350ml) fell 28.1% to rank 9, and CBD:THC 2:1 Purple Grape Ginger Lime Sparkling Soda (20mg CBD, 10mg THC, 350ml) climbed 54.8% to rank 6. With eight of the top ten in the Tropical Citrus and Mango/Guava/Blue Raspberry family of CBD/THC 2:1 beverages and only one notable decline under -10%, the pattern implies Green Monke is consolidating around mid-dose CBD-forward formats where flavor extensions can quickly gain rank.
Top Selling Cannabis Brands
Data for this report comes from real-time sales reporting by participating cannabis retailers via their point-of-sale systems, which are linked up with Headset’s business intelligence software. Headset’s data is very reliable, as it comes digitally direct from our partner retailers. However, the potential does exist for misreporting in the instance of duplicates, incorrectly classified products, inaccurate entry of products into point-of-sale systems, or even simple human error at the point of purchase. Thus, there is a slight margin of error to consider. Brands listed on this page are ranked in the top twenty within the market and product category by total retail sales volume.

