May-2026
Sales
Trend
6-Month
Product Count
SKUs
Avg Price
YoY Sales Change
YoY Price Change
Market Insights Snapshot
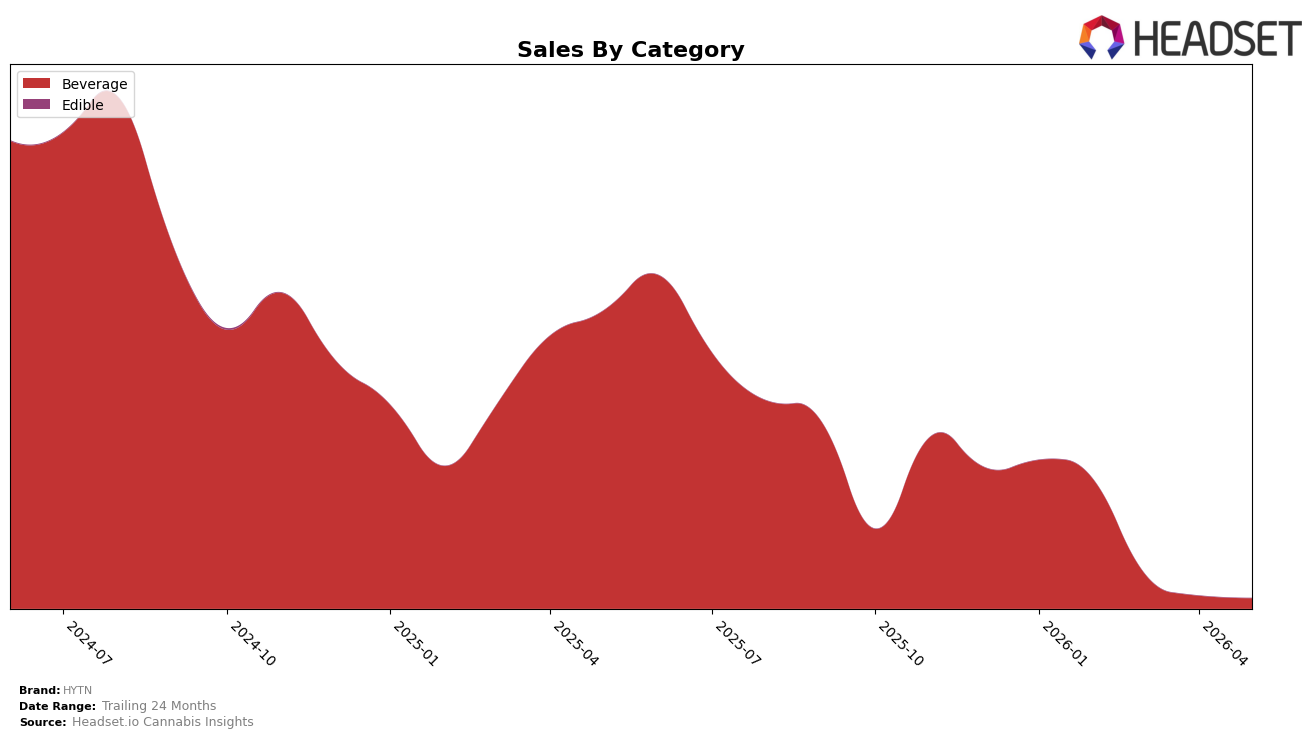
In May 2026, HYTN’s mix consolidated entirely into Beverage at 100.0% share, with no other categories contributing, while Beverage sales fell -96.58% year over year and -19.51% month over month. The average price in Beverage at $7.61 paired with a -26.92% YoY price change suggests volume retention did not offset the contraction, and the brand’s overall sales decline of -96.58% YoY mirrors the category-specific drop. The pattern implies HYTN is operating as a single-category brand with concentrated risk, where price reductions have not translated into volume or share recovery.
With Beverage as the sole pillar, the -19.51% MoM decline in May 2026 alongside a -96.58% YoY contraction indicates limited elasticity despite a -26.92% YoY price move, and a 100.0% category share within the brand mix leaves no buffer from adjacent categories. The absence of a reported rank in Beverage in British Columbia combined with total category concentration points to a positioning that hinges on reviving Beverage velocity rather than diversifying, implying near-term focus should be SKU rationalization or pack-price architecture within Beverage rather than expansion bets.
Competitive Landscape
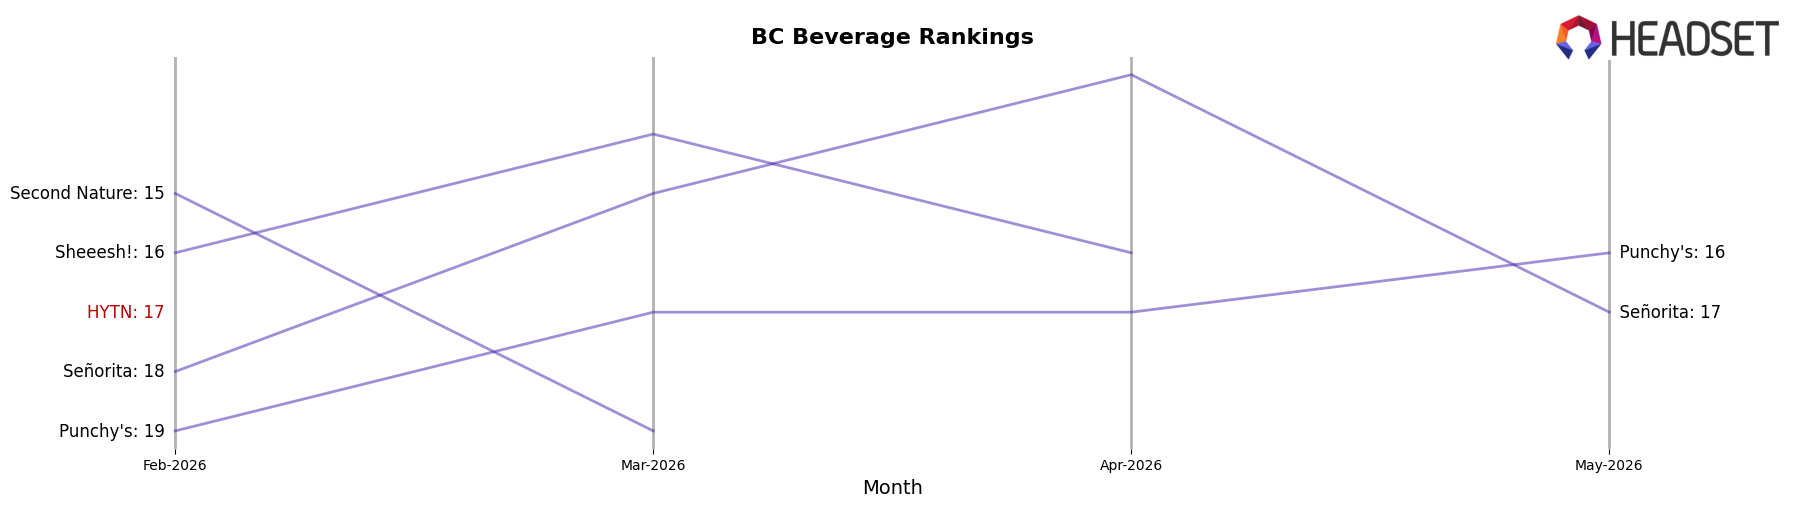
HYTN sits at #24 in BC Beverage for May 2026, down 14 positions year over year from #10, and 7 positions below its February 2026 level of #17; meanwhile, the brand’s historical peak was #8 in November 2024, creating a 16-rank slide from peak to current. Competitors moved in the opposite direction: Bubble Kush advanced to #1 from #3 year over year while growing sales by 62.4%, and Mollo climbed to #2 from #4 with 116.0% YoY sales growth; even Ray's Lemonade jumped to #5 from #8 with 206.6% YoY sales growth, widening the gap. The pattern implies HYTN’s rank trajectory is being pulled down by faster-moving leaders, signaling that without a reversal of share loss against top-five climbers, further erosion from the top 20 is likely.
Notable Products
Blood Orange Sparkling Water (10mg THC, 355ml) posted the steepest movement in May 2026 with a -55.96% month-over-month change while holding the number 2 rank, indicating a sharp pullback even as it remained a top-tier SKU. In contrast, Rosewater Lemonade Drink (10mg THC, 355ml) rose +13.78% month over month to the number 1 rank with $1,288 in sales, widening the performance gap between the top two positions. With Citrus Nano Shot (100mg THC, 50ml) entering at number 3 and all top three items in Beverage, the concentration at the top suggests HYTN is consolidating around drinkable formats while reassessing flavor breadth within that lane.
Top Selling Cannabis Brands
Data for this report comes from real-time sales reporting by participating cannabis retailers via their point-of-sale systems, which are linked up with Headset’s business intelligence software. Headset’s data is very reliable, as it comes digitally direct from our partner retailers. However, the potential does exist for misreporting in the instance of duplicates, incorrectly classified products, inaccurate entry of products into point-of-sale systems, or even simple human error at the point of purchase. Thus, there is a slight margin of error to consider. Brands listed on this page are ranked in the top twenty within the market and product category by total retail sales volume.

