.svg)

Sep-2026
Sales
Trend
6-Month
Product Count
SKUs
Avg Price
YoY Sales Change
YoY Price Change


Market Insights Snapshot
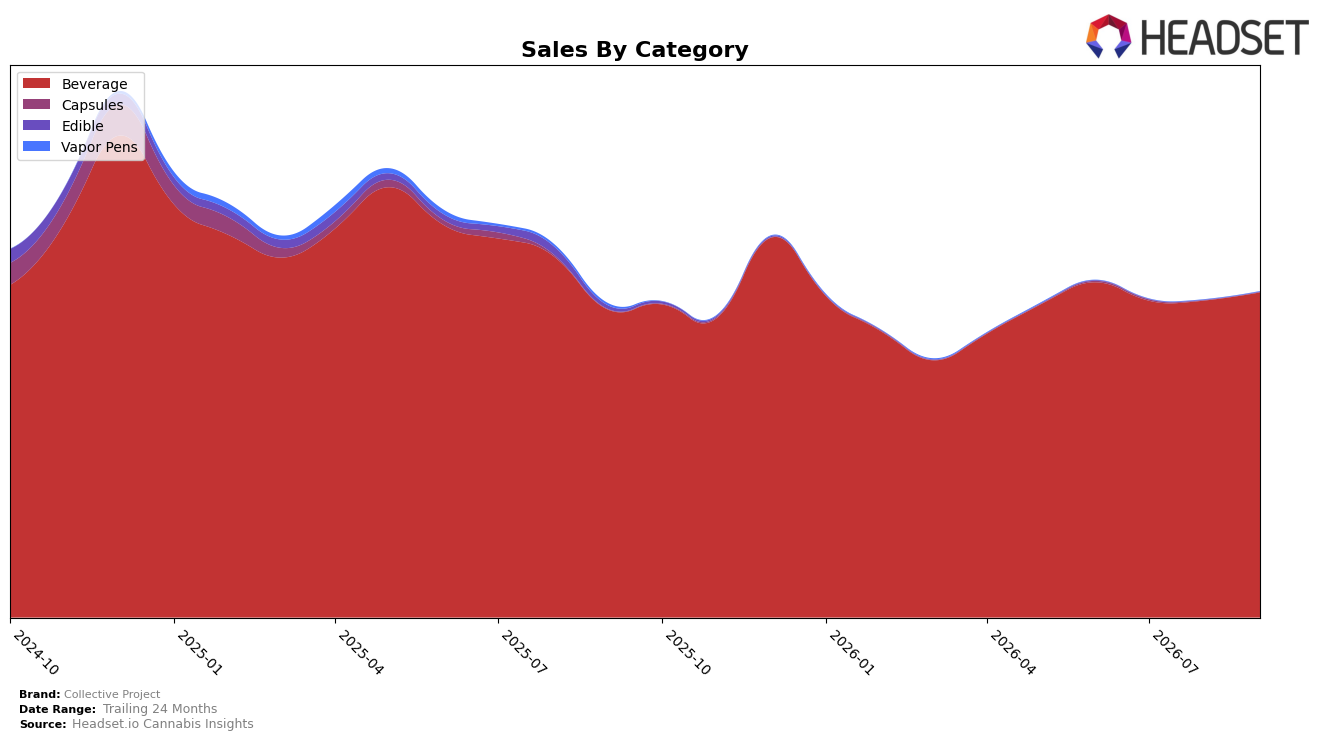
In September 2026, Collective Project’s category mix is fully concentrated in Beverage at 100.0% share, with Beverage sales up 5.63% year over year and 2.56% month over month, while overall brand sales grew 3.88% year over year and average price rose 2.75% year over year. The brand’s category rank in Beverage in Alberta stands at position 7, and the top province for the brand is ON, implying that a single-category focus is sustaining modest YoY unit momentum but also tethering performance to Beverage-specific price and rank dynamics.
The concentration in Beverage aligns the brand’s positioning to price-led premiumization and rank stability, as a 2.75% YoY price increase alongside a 5.63% Beverage YoY lift and a 2.56% MoM gain suggests elastic demand headroom even while the brand sits at rank 7 in Beverage in Alberta. Given the 24‑month brand sales change of -9.08% against the current 100.0% Beverage mix, the pattern implies that continued gains will depend on reinforcing depth within Beverage rather than breadth across categories, using September 2026’s MoM uptick and Alberta rank 7 as signals to target incremental share wins where pricing tolerance remains evident.
Competitive Landscape
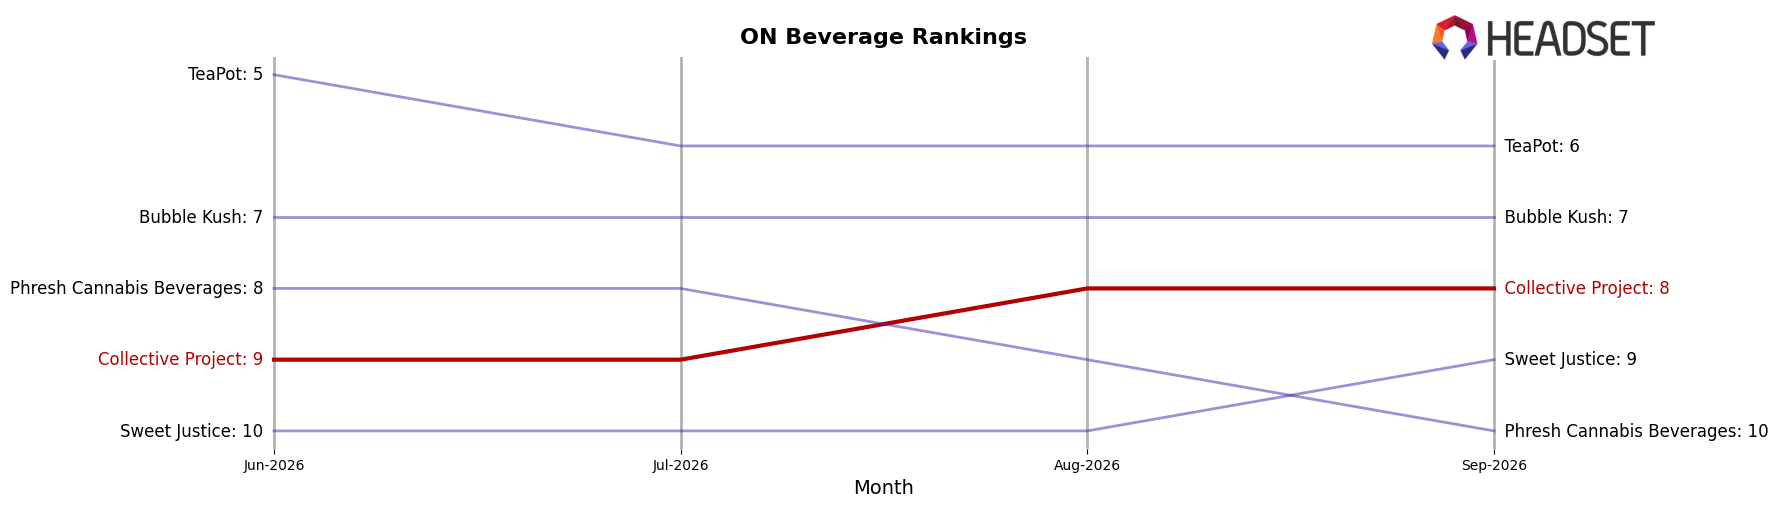
Collective Project sits at #8 in ON Beverage for September 2026, down 3 positions year over year from #5, but edging up 1 spot from #9 over the latest three-month window; against this backdrop, Versus climbed from #2 to #1 with 9.7% YoY sales growth while XMG slipped from #1 to #2 with a 20.5% YoY sales decline. The brand’s current #8 stands well below its peak #3 in June 2025 and trails mid-pack movers like Mary Jones, which rose from #8 to #5 on 53.6% YoY growth, indicating that Collective Project’s downward YoY rank change alongside a modest recent uptick points to a need to convert near-term stability into sustained share recovery amid faster-moving leaders.
Notable Products
Botany - CBD/THC 1:1 White Peach & Cardamom Sparkling Botanical Water (10mg CBD, 10mg THC, 355ml) posted the steepest decline at -37.8% and slid to rank 7, while the leader CBD/THC 1:1 Original Blood Orange, Yuzu & Vanilla Sparkling Juice (10mg CBD, 10mg THC, 355ml) dipped -7.4% yet held rank 1. In contrast, Happy Place - CBG/THC 1:2 Mango Peach & Yuzu Juice Sparkling Beverage (5mg CBG, 10mg THC, 355ml) climbed +30.9% to rank 6 and the 4-Pack of Original Blood Orange fell -28.0% at rank 10, indicating single-can formats are outpacing multipacks. With eight of the top ten in Beverage and multiple CBG-forward SKUs rising while a CBD/THC 1:1 botanical water falls, the mix implies a pivot toward higher-THC/CBG refreshers over lighter botanical variants, concentrating near the top three ranks where +18.4% and +8.2% movers gained share.
Top Selling Cannabis Brands






Data for this report comes from real-time sales reporting by participating cannabis retailers via their point-of-sale systems, which are linked up with Headset’s business intelligence software. Headset’s data is very reliable, as it comes digitally direct from our partner retailers. However, the potential does exist for misreporting in the instance of duplicates, incorrectly classified products, inaccurate entry of products into point-of-sale systems, or even simple human error at the point of purchase. Thus, there is a slight margin of error to consider. Brands listed on this page are ranked in the top twenty within the market and product category by total retail sales volume.

