May-2026
Sales
Trend
6-Month
Product Count
SKUs
Avg Price
YoY Sales Change
YoY Price Change
Market Insights Snapshot
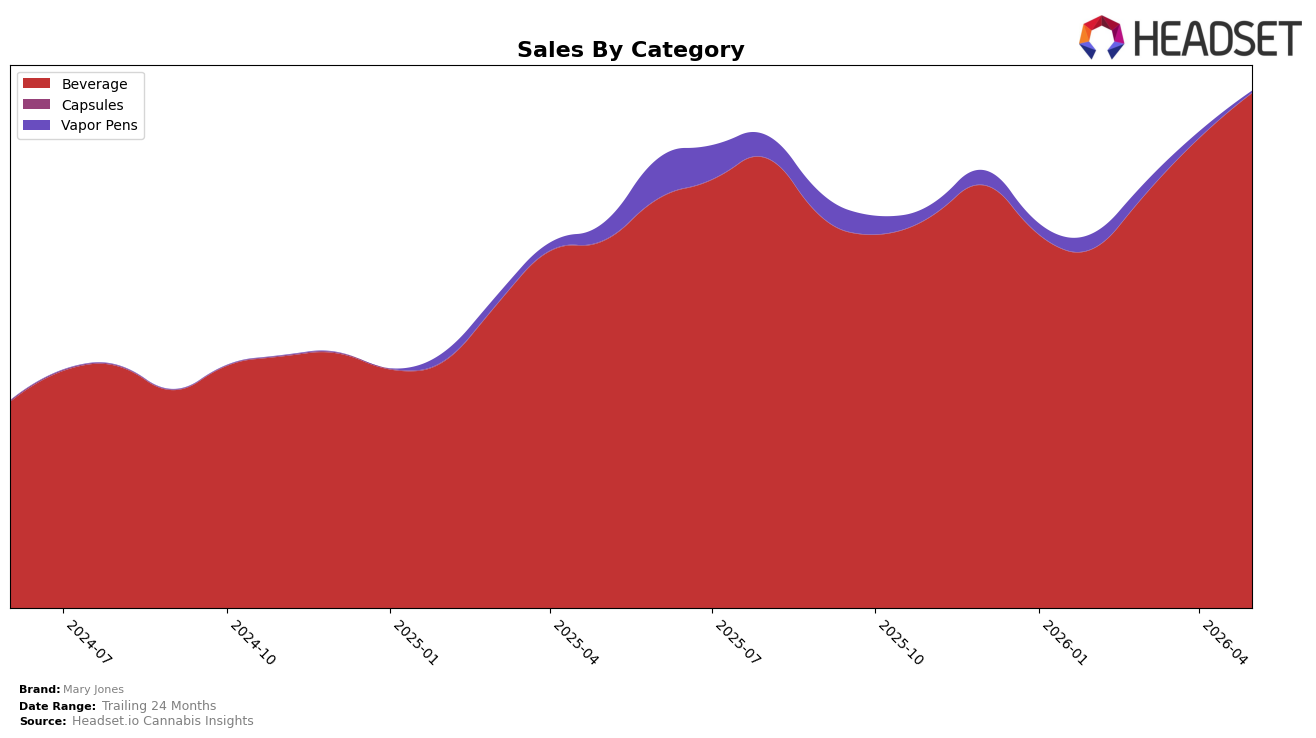
Mary Jones concentrated 99.68% category share in Beverage during May 2026, with Beverage sales up 40.30% year over year and 9.71% month over month, while Vapor Pens fell to 0.32% share with a -90.24% year-over-year change and a -72.70% month-over-month change. Average price declined 13.08% year over year to $8.99 alongside brand sales growth of 34.43% year over year, and Beverage average price sat at $8.97 compared to $32.18 in Vapor Pens. With Mary Jones ranked 1 in Beverage in Michigan, the share consolidation and price drop imply volume-led gains are concentrating in Beverage as the Vapor Pens experiment unwinds.
The pivot toward Beverage, gaining 9.71% month over month while Vapor Pens contracted -72.70% month over month, suggests assortment pruning is reinforcing the #1 rank in Beverage and reallocating demand to lower-price, higher-velocity units. The 40.30% Beverage year-over-year lift alongside a 13.08% brand-wide price decrease indicates price elasticity is favoring unit expansion in the core, and the -90.24% year-over-year collapse in Vapor Pens limits distraction from the flagship offering. The pattern implies Mary Jones is positioning as a price-competitive Beverage specialist, converting price reductions into share defense and volume scale rather than pursuing premium adjacency in Vapor Pens.
Competitive Landscape
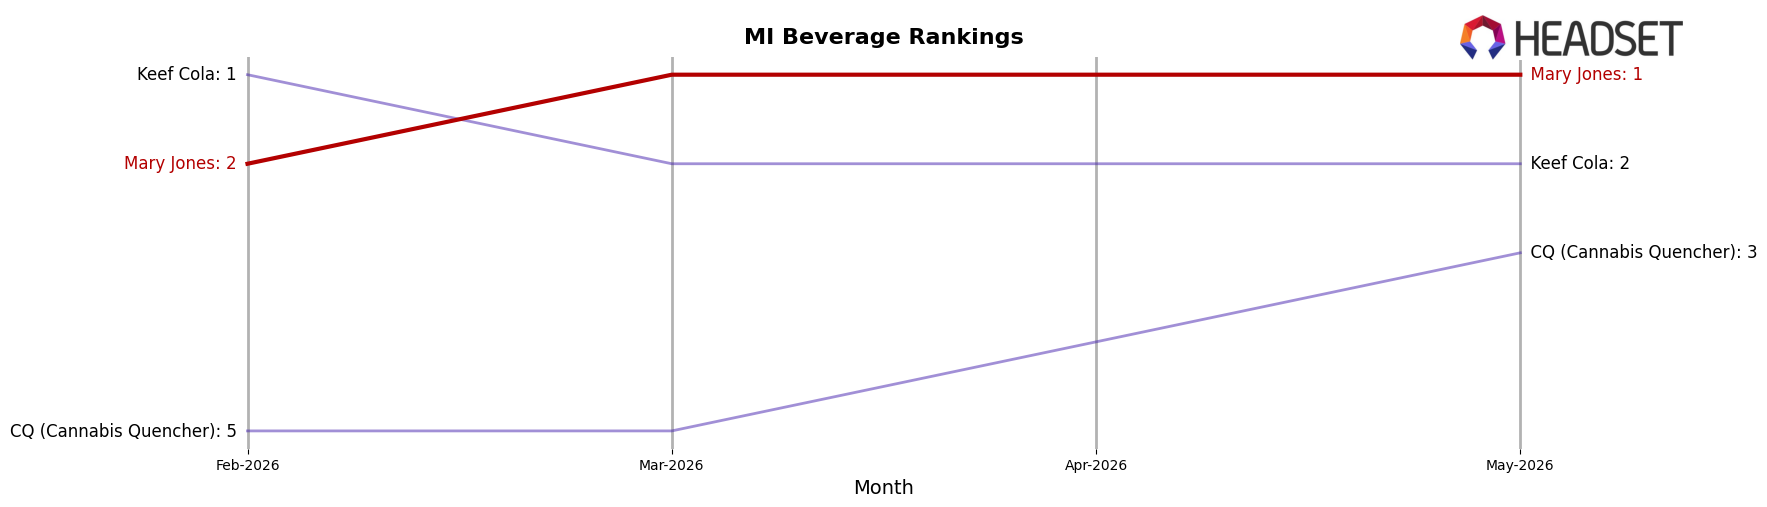
Mary Jones sits at #1 in MI Beverage in May 2026 after rising 1 rank position year over year from #2, and improving 1 spot since February 2026 when it held #2; this ascent comes as Keef Cola slipped from #1 to #2 with a -9.6% YoY sales change and as CQ (Cannabis Quencher) climbed from #8 to #3 with +150.3% YoY sales growth, indicating that Mary Jones’ move to #1 coincides with a reshuffling where a legacy leader ceded ground while a fast-riser compressed the gap, implying Mary Jones must defend a narrow lead as momentum concentrates below it.
Notable Products
Zero Berry Lemonade Soda (10mg THC, 12oz, 355ml) delivered the headline move with +42.3% month over month and held rank 1, while Berry Lemonade Soda (100mg THC, 12oz, 355ml) rose +11.3% at rank 2; no top-10 SKU declined more than -1.4%, and Green Apple Soda (100mg THC, 12oz, 355ml) slipped -1.4% at rank 5. Eight of the top ten are Beverage SKUs in the lemonade and soda family, and Root Beer Soda (100mg THC, 16oz) advanced +26.6% to rank 7 as MF Grape Soda (100mg THC, 16oz) climbed +30.1% at rank 9; together, this tilt toward zero-sugar and high-dosage formats implies Mary Jones is concentrating demand into polar ends of potency and calorie preference.
Top Selling Cannabis Brands
Data for this report comes from real-time sales reporting by participating cannabis retailers via their point-of-sale systems, which are linked up with Headset’s business intelligence software. Headset’s data is very reliable, as it comes digitally direct from our partner retailers. However, the potential does exist for misreporting in the instance of duplicates, incorrectly classified products, inaccurate entry of products into point-of-sale systems, or even simple human error at the point of purchase. Thus, there is a slight margin of error to consider. Brands listed on this page are ranked in the top twenty within the market and product category by total retail sales volume.

