Market Insights Snapshot
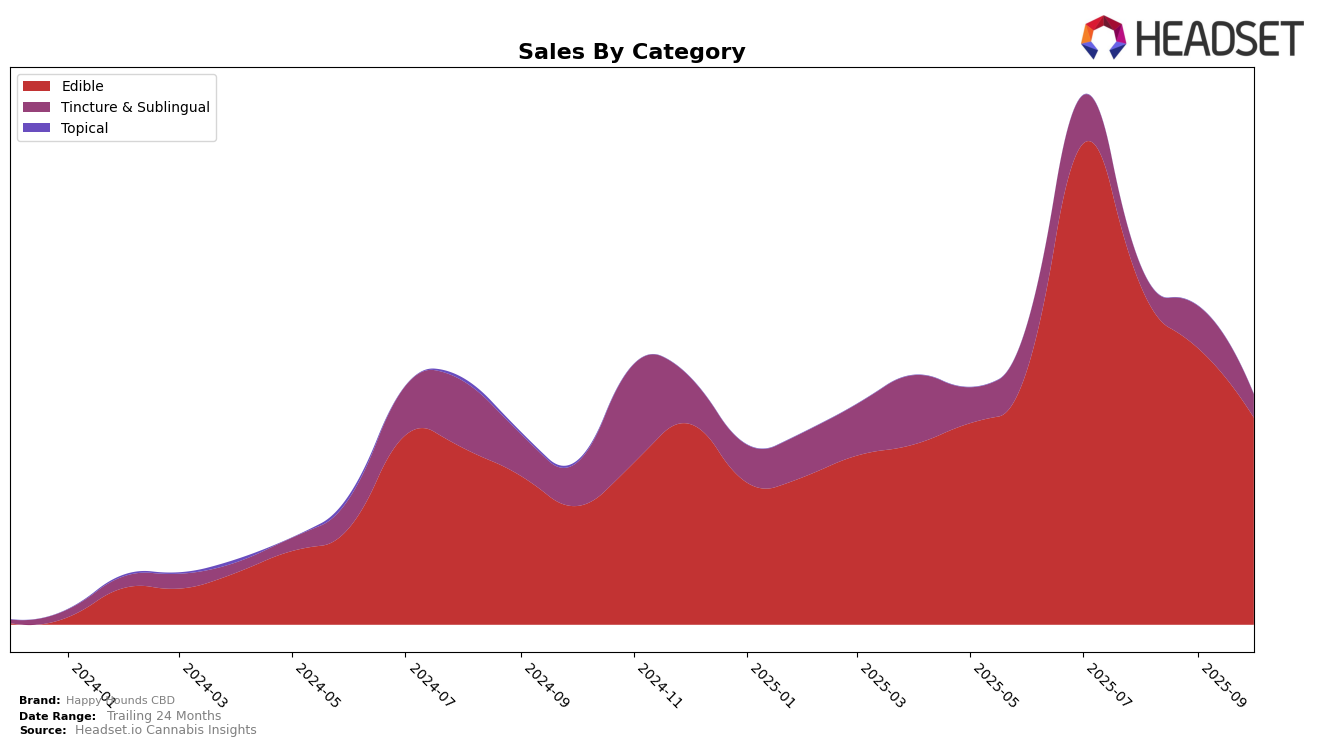
Happy Hounds CBD has shown a varied performance across different categories and states, with some notable movements in the rankings. In New York, the brand was ranked 77th in the Edible category in July 2025, but unfortunately, it did not make it into the top 30 in the following months. This indicates a decline in market presence for Happy Hounds CBD within this category, suggesting that the brand may need to reassess its strategies or product offerings in New York to regain its standing. The absence of a ranking in subsequent months could be seen as a negative sign, especially in a competitive market like New York.
While the specific sales figures for the later months are not provided, the July 2025 sales figure of $11,861 gives a baseline for understanding their market position at that time. The lack of ranking in August, September, and October suggests that Happy Hounds CBD might be facing challenges in maintaining or growing its market share in the Edible category. This could be due to increased competition or changes in consumer preferences. Observing these trends can provide insights into the brand's performance and potential areas for improvement or growth within the state.
Competitive Landscape
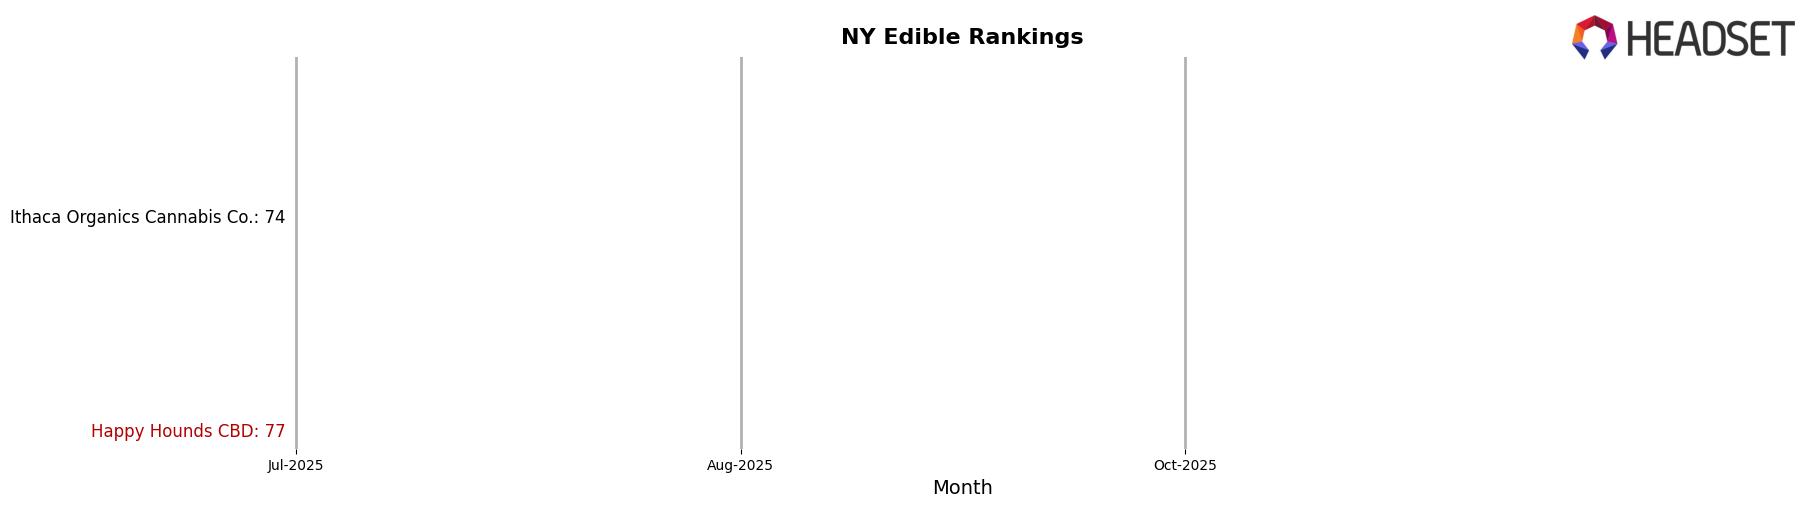
In the competitive landscape of the New York edible cannabis market, Happy Hounds CBD has experienced notable fluctuations in its rank, which could impact its sales trajectory. As of July 2025, Happy Hounds CBD was ranked 77th, slightly trailing behind Ithaca Organics Cannabis Co. at 74th and Glenna's at 72nd. However, both Ithaca Organics Cannabis Co. and Glenna's did not maintain their positions in the top 20 in subsequent months, indicating potential volatility or a decline in their market presence. This opens up an opportunity for Happy Hounds CBD to capitalize on the shifting competitive dynamics and potentially improve its rank and sales by leveraging strategic marketing and product differentiation. The absence of these competitors in the top ranks in later months suggests a possible decline in their sales, which Happy Hounds CBD could exploit to enhance its market share in the New York edible cannabis category.
Notable Products
In October 2025, the top-performing product from Happy Hounds CBD was the CBD Calm + Joint Bacon Strips Chews 30-Pack (150mg CBD), maintaining its first-place rank for four consecutive months with notable sales of 90 units. Following closely, the CBD Calm Peanut Butter Chews 30-Pack (150mg CBD) consistently held the second position, although its sales have gradually decreased since July. The CBD Calm Extra Strength Drops (500mg CBD) remained third in October, having improved its rank from fourth in July. Meanwhile, the CBD Calm + Coat Salmon Peanut Butter Tincture (250mg CBD) held steady in fourth place, despite a significant drop in sales since July. Overall, the rankings for these top products have shown consistency, with minor fluctuations in sales figures.
Top Selling Cannabis Brands
Data for this report comes from real-time sales reporting by participating cannabis retailers via their point-of-sale systems, which are linked up with Headset’s business intelligence software. Headset’s data is very reliable, as it comes digitally direct from our partner retailers. However, the potential does exist for misreporting in the instance of duplicates, incorrectly classified products, inaccurate entry of products into point-of-sale systems, or even simple human error at the point of purchase. Thus, there is a slight margin of error to consider. Brands listed on this page are ranked in the top twenty within the market and product category by total retail sales volume.

