Jun-2026
Sales
Trend
6-Month
Product Count
SKUs
Avg Price
YoY Sales Change
YoY Price Change
Market Insights Snapshot
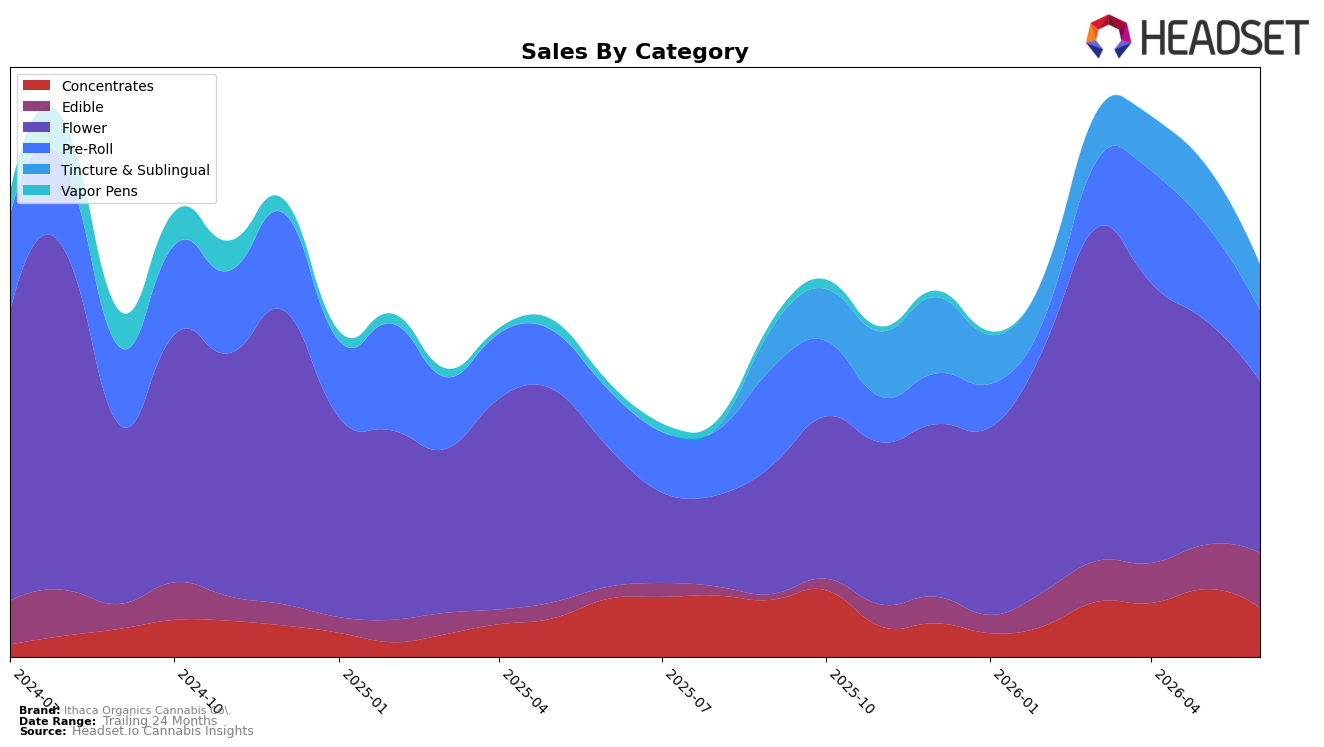
Ithaca Organics Cannabis Co. concentrated 43.81% of June 2026 sales in Flower with a 23.06% year-over-year gain but a 23.76% month-over-month decline, while Pre-Roll held 18.07% share with 23.65% YoY growth and a 26.93% MoM pullback; this contrasts with Edible at 14.01% share, surging 366.81% YoY and up 24.56% MoM. Concentrates represented 12.50% share and fell 15.59% YoY alongside a 27.57% MoM decline, and Tincture & Sublingual at 11.60% share dropped 22.83% MoM with no YoY baseline, pointing to a broad intra-month reset in inhalables even as Edible expanded. With average price down 3.22% YoY and brand sales up 43.06% YoY, the pattern implies mix-led growth tilted toward lower-priced, faster-turning segments despite short-term softness in the two largest inhalable categories.
Edible’s triple-digit 366.81% YoY and 24.56% MoM growth against simultaneous MoM declines of 23.76% in Flower and 26.93% in Pre-Roll implies a pivot toward non-inhalable demand that can cushion seasonal or regulatory swings in inhalables. Holding 43.81% share in Flower while ranked 87 in Flower in New York indicates depth but not leadership in the core category, so the accelerating Edible contribution and a 3.22% YoY price deflation suggest a value-access strategy to expand reach, with risk concentrated in Concentrates’ 15.59% YoY decline and 27.57% MoM drop signaling a need to rationalize SKUs where elasticity or shelf velocity is weakening.
Competitive Landscape
Ithaca Organics Cannabis Co. is ranked #87 in NY Flower in June 2026, a 10-place drop from #77 year over year, and a 38-position fall from #49 in March 2026; against a longer arc, the brand sits 55 spots below its peak of #32 from August 2024. Meanwhile, Find. moved up from #3 to #1 and Leal advanced from #7 to #2, contrasting with Ithaca Organics Cannabis Co.’s decline and indicating share consolidation near the top; paired with RYTHM rising from #10 to #5 while Dank. By Definition slid from #1 to #3, the pattern implies Ithaca Organics Cannabis Co. is being outpaced by both climbers and stabilizing leaders, signaling a need to counter sustained rank erosion rather than short-term volatility.

Notable Products
Peach Maraschino Pre-Roll (1g) posted the steepest decline in June 2026 at -60.8% MoM and fell to rank 3, while Zoap Pre-Roll (1g) slid -19.4% MoM yet held rank 1. Lilac Diesel GMO Pre-Roll (1g) inched up 0.3% MoM at rank 2, and White Runtz Pre-Roll (1g) dropped -63.3% MoM to rank 6. With seven of the top ten coming from the Pre-Roll category and two Edibles entering the top ten, the mix indicates reliance on Pre-Rolls is being stress‑tested by volatility as Edibles begin to anchor share.
Top Selling Cannabis Brands
Data for this report comes from real-time sales reporting by participating cannabis retailers via their point-of-sale systems, which are linked up with Headset’s business intelligence software. Headset’s data is very reliable, as it comes digitally direct from our partner retailers. However, the potential does exist for misreporting in the instance of duplicates, incorrectly classified products, inaccurate entry of products into point-of-sale systems, or even simple human error at the point of purchase. Thus, there is a slight margin of error to consider. Brands listed on this page are ranked in the top twenty within the market and product category by total retail sales volume.

