Jan-2026
Sales
Trend
6-Month
Product Count
SKUs
Avg Price
YoY Sales Change
YoY Price Change
Market Insights Snapshot
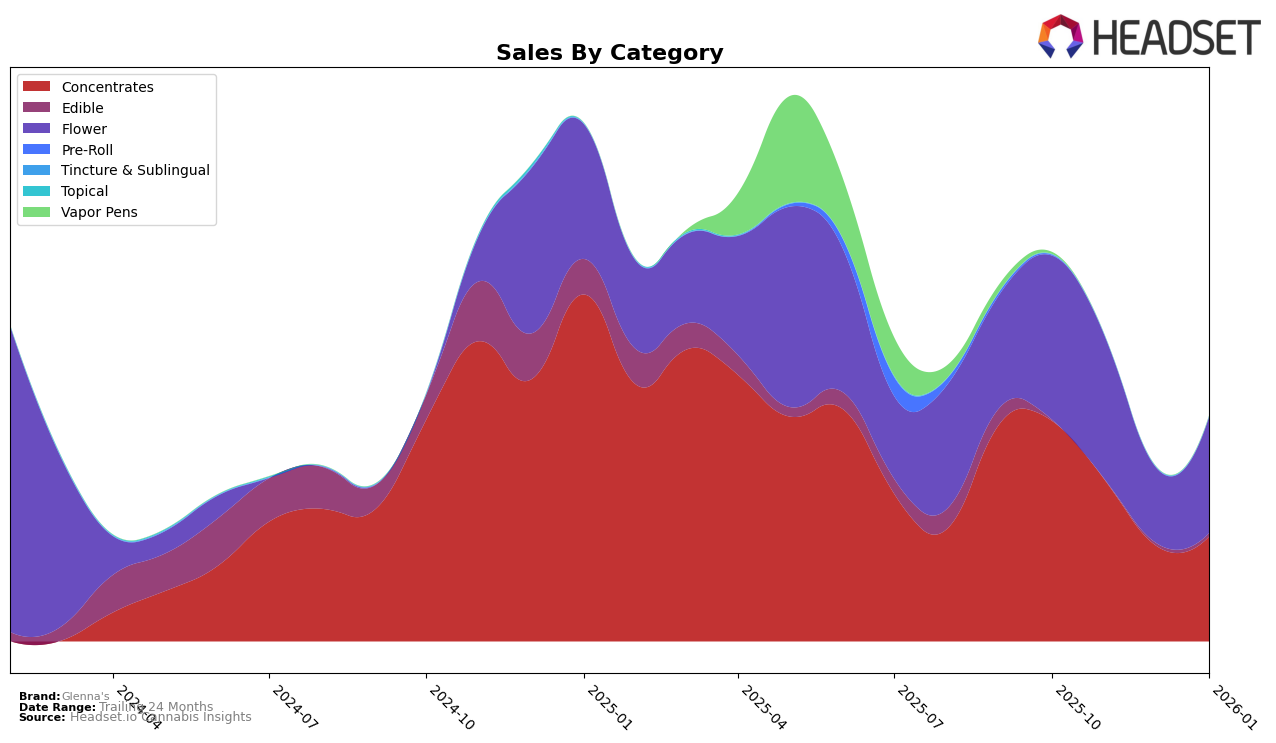
Glenna's, a notable player in the cannabis industry, has shown varied performance across different states and product categories. In the New York market, Glenna's has experienced fluctuations within the Concentrates category. Starting from a 10th place ranking in October 2025, the brand saw a decline to 16th in November and further dropped to 24th in December. However, there was a slight recovery in January 2026, with a move back up to 22nd place. The decline in rankings during the last quarter of 2025 indicates challenges in maintaining a competitive edge, which could be attributed to increased competition or shifts in consumer preferences. Despite these challenges, the bounce back in January suggests potential adjustments in strategy or market conditions that may have favored Glenna's.
It's noteworthy that Glenna's was not listed in the top 30 brands in some categories or states, which could imply areas for growth or indicate highly competitive markets where the brand has yet to establish a strong foothold. The sales figures from October 2025 to January 2026 show a significant drop in revenue, particularly between October and December, which aligns with their declining rankings. However, the slight increase in sales in January could hint at a recovery or a seasonal trend. Understanding these dynamics could provide valuable insights into Glenna's strategic positioning and potential areas for expansion or improvement.
Competitive Landscape
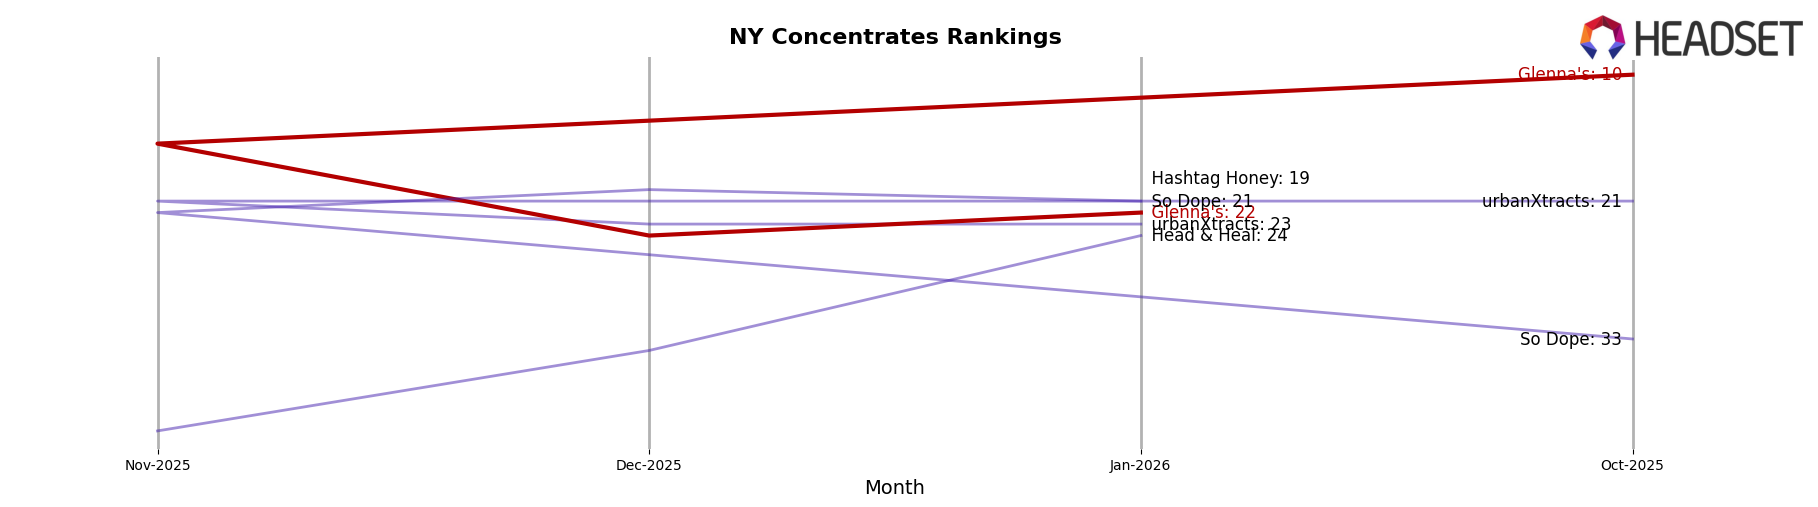
In the New York concentrates market, Glenna's has experienced notable fluctuations in its rank and sales over the past few months. Starting from a strong position at rank 10 in October 2025, Glenna's saw a decline to rank 16 in November and further to rank 24 in December, before slightly recovering to rank 22 in January 2026. This downward trend in rank coincides with a significant drop in sales from October to December, although there was a modest recovery in January. In contrast, urbanXtracts maintained a stable rank around the 21-23 range, with relatively consistent sales figures, indicating a steady market presence. Meanwhile, So Dope improved its rank from 33 in October to 21 in January, with a corresponding increase in sales, suggesting a growing competitive threat. The re-entry of Hashtag Honey into the top 20 in January, after being absent in previous months, also adds pressure on Glenna's to regain its footing in this competitive landscape. These dynamics highlight the need for Glenna's to strategize effectively to reclaim its earlier market position and counter the rising competition.
Notable Products
In January 2026, Glenna's top-performing product was RS-11 (3.5g) from the Flower category, maintaining its first-place rank consistently since October 2025, with sales reaching 1835 units. RS-11 Cured Resin (1g) in the Concentrates category also held steady in second place across the same period. Apex Cured Resin (1g) improved its rank from fourth in December to third in January, indicating a positive trend in sales. Black Runtz Cured Resin Sugar (1g) saw a slight drop from third to fourth place, while Apex Resin Badder (1g) entered the rankings in fifth place after being unranked in December. Overall, the data illustrates stable leadership by RS-11 products and dynamic shifts within the Concentrates category.
Top Selling Cannabis Brands
Data for this report comes from real-time sales reporting by participating cannabis retailers via their point-of-sale systems, which are linked up with Headset’s business intelligence software. Headset’s data is very reliable, as it comes digitally direct from our partner retailers. However, the potential does exist for misreporting in the instance of duplicates, incorrectly classified products, inaccurate entry of products into point-of-sale systems, or even simple human error at the point of purchase. Thus, there is a slight margin of error to consider. Brands listed on this page are ranked in the top twenty within the market and product category by total retail sales volume.

