.svg)

Sep-2026
Sales
Trend
6-Month
Product Count
SKUs
Avg Price
YoY Sales Change
YoY Price Change


Where to Buy
Hashables is stocked at 148 licensed dispensaries across Massachusetts, New Jersey, and 3 other states, 91 of them in Massachusetts, with the deepest coverage in Quincy, Springfield, Fall River, Taunton, and Worcester. Search by ZIP code or city below to find the closest one.
Market Insights Snapshot
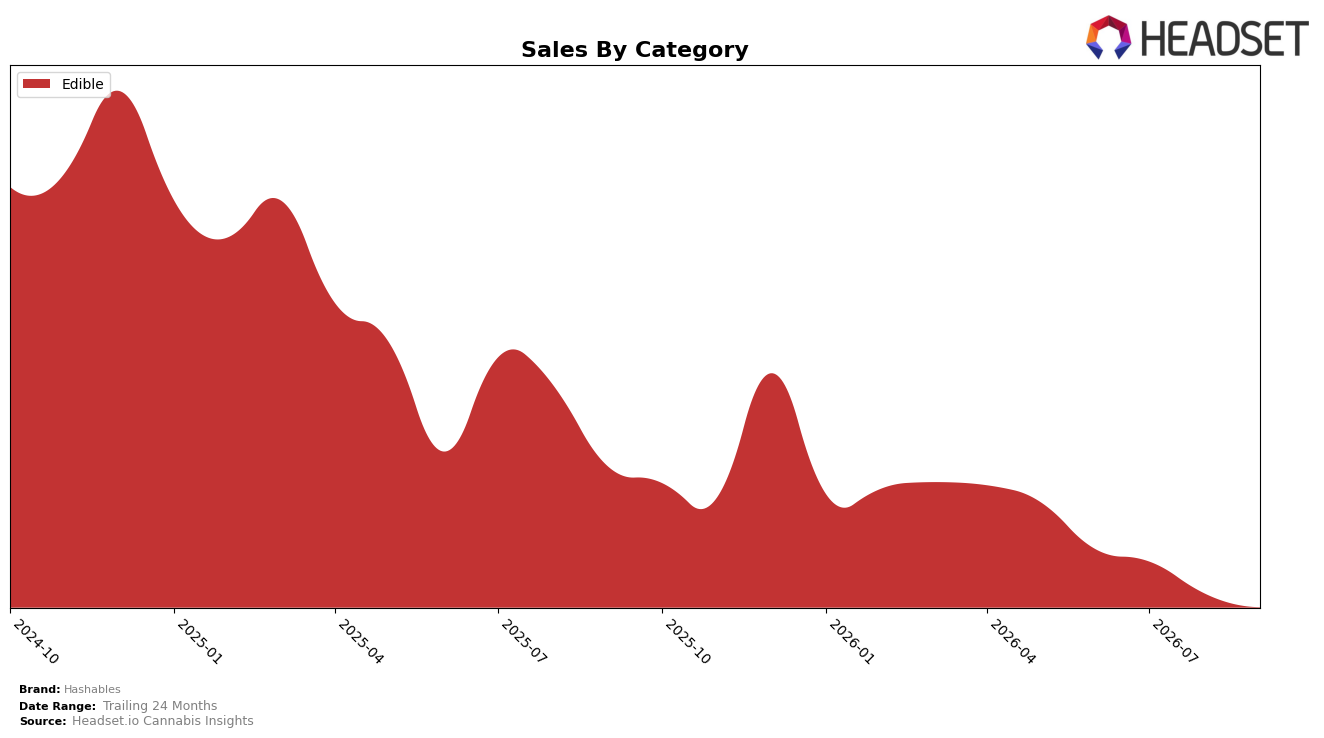
Edible accounted for 100.0% of Hashables in September 2026, with year-over-year sales down 28.33% and month-over-month sales down 3.71%. Average price declined 8.07% YoY to $20.93, while rank in Massachusetts Edible held at position 20, signaling stable placement despite contraction. The pattern implies an all-in Edible concentration that magnifies exposure to category drag: a single-category mix at 100.0% with a 28.33% YoY decline and a 3.71% MoM dip means portfolio breadth is not cushioning volatility, and price cuts of 8.07% have not reversed unit or revenue trajectory.
With total brand sales down 28.33% YoY alongside a static rank of 20 and a 3.71% MoM pullback, Hashables is sustaining shelf presence but conceding velocity, indicating price-led tactics are preserving slotting rather than expanding share. The 8.07% YoY price reduction to $20.93 coupled with a 100.0% Edible reliance points to a need for mix-led differentiation: maintaining rank at 20 while sales contract suggests relative parity to peers on placement but weaker repeat or basket depth, so future positioning hinges on either trading up within Edible or reintroducing category adjacency to dilute a 28.33% YoY decline risk.
Competitive Landscape
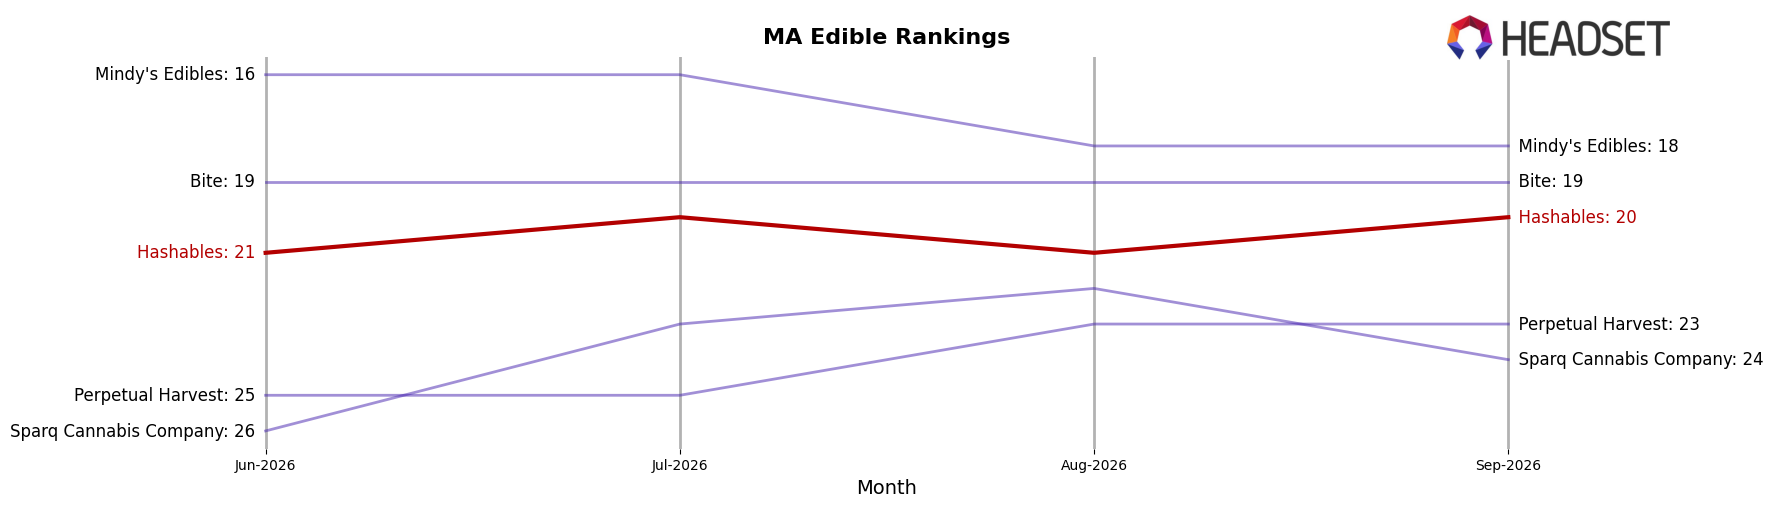
Hashables sits at rank #20 in MA Edible for September 2026, sliding 5 positions year over year from #15, while improving 1 spot versus three months ago from #21; the brand’s peak of #13 in April 2025 is now 7 ranks ahead of its current standing. In contrast, Kanha / Sunderstorm holds #2 after a 1-position YoY rise and Wyld is #3 after climbing from #4, indicating upward mobility among leaders as Hashables moves the other way; additionally, Betty's Eddies is #4 despite a -1.1% YoY sales change, suggesting rank gains are achievable without broad category tailwinds. The pattern implies Hashables’ rank trajectory is drifting from prior peak toward the mid-pack, signaling that recapturing share will likely require outpacing competitors who are posting simultaneous rank gains and positive double-digit YoY sales growth.
Notable Products
Watermelon Jolt Solventless Hash Infused Gummies 20-Pack (100mg) posted the steepest decline in September 2026 at -18% MoM while dropping to rank 2, and Tropical Typhoon Solventless Rosin Gummies 20-Pack (100mg) also fell -17% MoM at rank 3; in contrast, Bangin' Berry Solventless Gummies 20-Pack (100mg) gained 7% MoM and held rank 1 with $48,305 in sales. With eight of the top ten SKUs concentrated in the Edible gummies family and Prickly Pear Rosin Gummies 20-Pack (100mg) sliding -14% MoM at rank 10, the mix shows growth concentrated at the top while the tail softens by double digits. Remberry Sunsetterzzz Gummies 20-Pack (100mg) rose 32% MoM into rank 9 even as CBD/CBN/THC 1:1:1 Remberry Sunsetterzz Hash Rosin Gummies 20-Pack (100mg CBD, 100mg CBN, 100mg THC) was flat at -0.1% MoM at rank 6, signaling flavor-led gains rather than functional-formulation expansion. The pattern implies Hashables is consolidating share around a few leading gummy flavors while secondary SKUs face churn, suggesting near-term focus on scaling winners and pruning underperforming variants.
Top Selling Cannabis Brands






Data for this report comes from real-time sales reporting by participating cannabis retailers via their point-of-sale systems, which are linked up with Headset’s business intelligence software. Headset’s data is very reliable, as it comes digitally direct from our partner retailers. However, the potential does exist for misreporting in the instance of duplicates, incorrectly classified products, inaccurate entry of products into point-of-sale systems, or even simple human error at the point of purchase. Thus, there is a slight margin of error to consider. Brands listed on this page are ranked in the top twenty within the market and product category by total retail sales volume.

