.svg)
Sep-2026
Sales
Trend
6-Month
Product Count
SKUs
Avg Price
YoY Sales Change
YoY Price Change


Where to Buy
Effin' Edibles is stocked at 158 licensed dispensaries across Massachusetts, New Jersey, and 2 other states, 56 of them in Massachusetts, with the deepest coverage in Boston, Springfield, Cambridge, Easthampton, and Framingham. Search by ZIP code or city below to find the closest one, or filter by product type if you are after a specific format.
Market Insights Snapshot
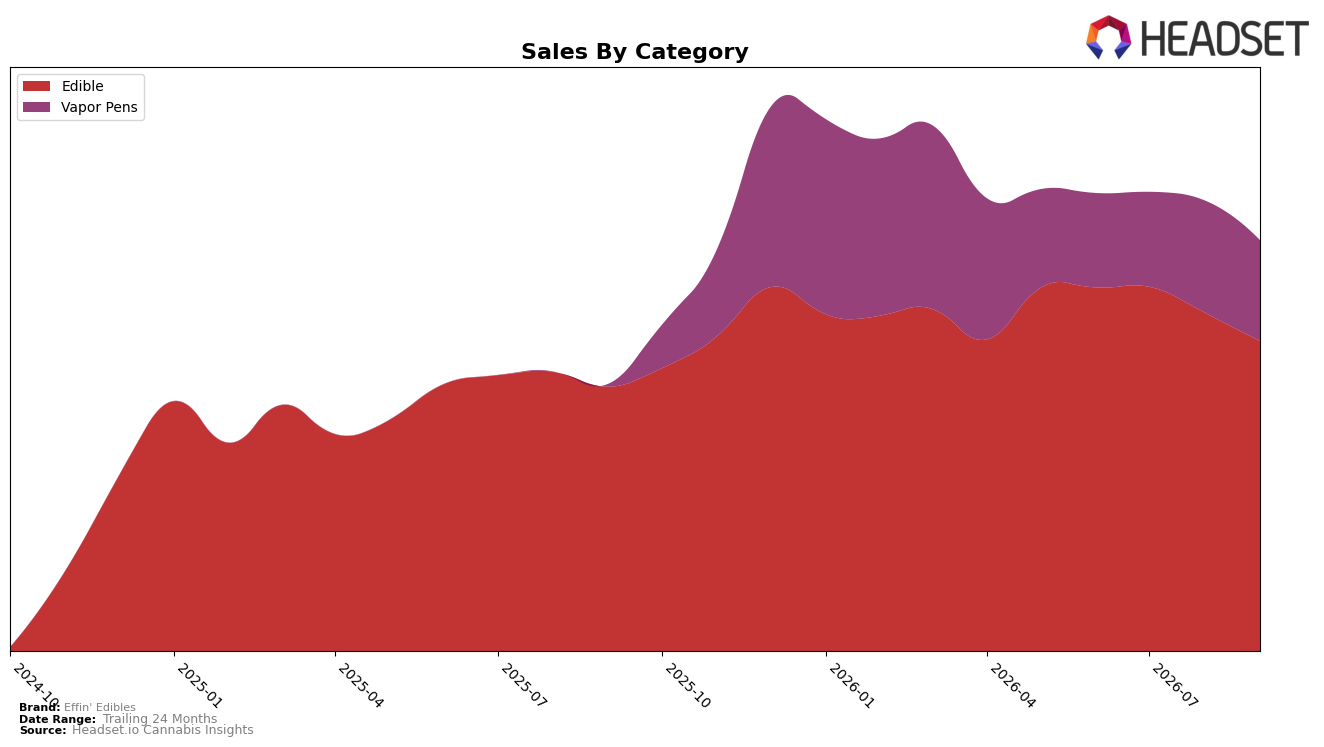
Effin' Edibles concentrated 75.53% of September 2026 sales in Edible while Vapor Pens carried 24.47%, with Edible up 17.33% year over year but down 8.38% month over month, and Vapor Pens surging 3,877.18% year over year but slipping 10.17% month over month. Average price rose 8.16% year over year to $17.60, while the brand ranked 12 in Edible in New Jersey; taken together, the mix shows a maturing Edible base cushioning volatility as Vapor Pens expand from a small base yet retrench sequentially.
The mix shift implies Effin' Edibles is anchoring its positioning to Edible in New Jersey, where a 17.33% Edible year-over-year gain and a rank of 12 indicate traction even as an 8.38% month-over-month dip and an 8.16% price increase pressure near-term velocity. Vapor Pens’ 3,877.18% year-over-year growth alongside a 10.17% month-over-month pullback signals trial-heavy expansion susceptible to monthly swings; sustaining share near 24.47% without eroding Edible’s 75.53% footprint points to a barbell strategy that can lift total brand sales 53.87% year over year while requiring tighter price-pack and promo control to stabilize sequential trends.
Competitive Landscape
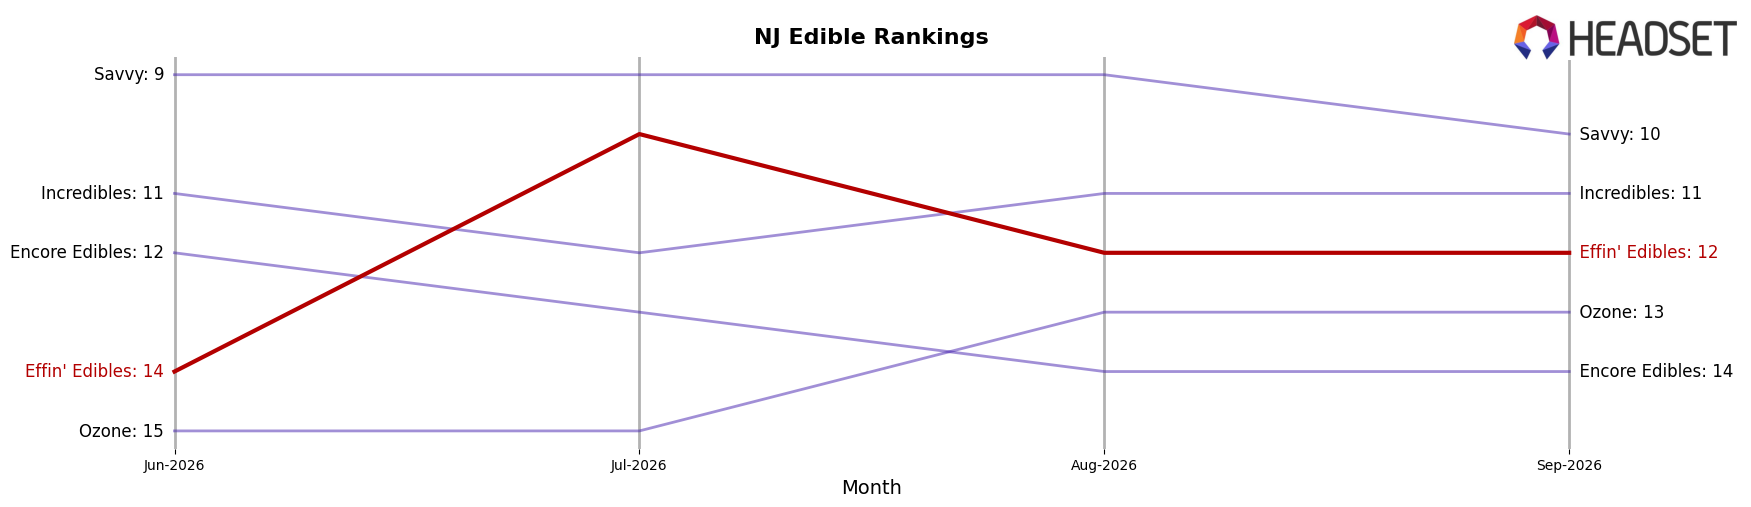
Effin' Edibles sits at rank #12 in New Jersey Edible for September 2026, improving 1 place from #13 year over year and 2 places from #14 in June 2026, while still 2 places below its peak of #10 from July 2026; by contrast, Wyld advanced from #3 to #2 as its sales grew 6.0% year over year and Select slid from #2 to #4 with a 35.8% sales decline, indicating Effin' Edibles is gaining relative position against a weakening upper tier even as category leaders like Gron / Grön hold #1 despite a 14.4% sales contraction; this mix of slight rank ascent and leaders’ negative comps implies Effin' Edibles’ trajectory is driven more by competitor softening than breakout share capture, setting up a window to press into the #10–#11 band over the next quarter.
Notable Products
The steepest movement in September 2026 came from Sleep - THC/CBN 2:1 Goodnight Grape Gummies 20-Pack (100mgTHC, 50mg CBN), which fell 33.4% MoM to rank 2 while Deep Sleep - THC/CBN/CBD 2:2:1 Dreamy Dark Cherry Gummies 10-Pack (100mg THC, 100mg CBN, 50mg CBD) slipped 9.3% at rank 1. Meanwhile, the broader gummy lineup was mixed, with CBD/THC/CBG/CBC 4:2:1:1 Soothing Sour Acai Gummies 10-Pack up 39.4% at rank 4 and Do It - THC/THCV 1:1 Amplified Apple Gummies 10-Pack down 13.5% at rank 6. At least eight of the top ten are Edible SKUs, and the only non-Edible, Deep Sleep - THC/CBN/CBG 14:1:1 Dreamy Dark Cherry Distillate Disposable (1g), entered at rank 9 with $24,387 in September 2026, implying the portfolio still leans toward multi-cannabinoid sleep and functional gummies despite tentative vapor expansion.
Top Selling Cannabis Brands






Data for this report comes from real-time sales reporting by participating cannabis retailers via their point-of-sale systems, which are linked up with Headset’s business intelligence software. Headset’s data is very reliable, as it comes digitally direct from our partner retailers. However, the potential does exist for misreporting in the instance of duplicates, incorrectly classified products, inaccurate entry of products into point-of-sale systems, or even simple human error at the point of purchase. Thus, there is a slight margin of error to consider. Brands listed on this page are ranked in the top twenty within the market and product category by total retail sales volume.

