Jun-2026
Sales
Trend
6-Month
Product Count
SKUs
Avg Price
YoY Sales Change
YoY Price Change
Market Insights Snapshot
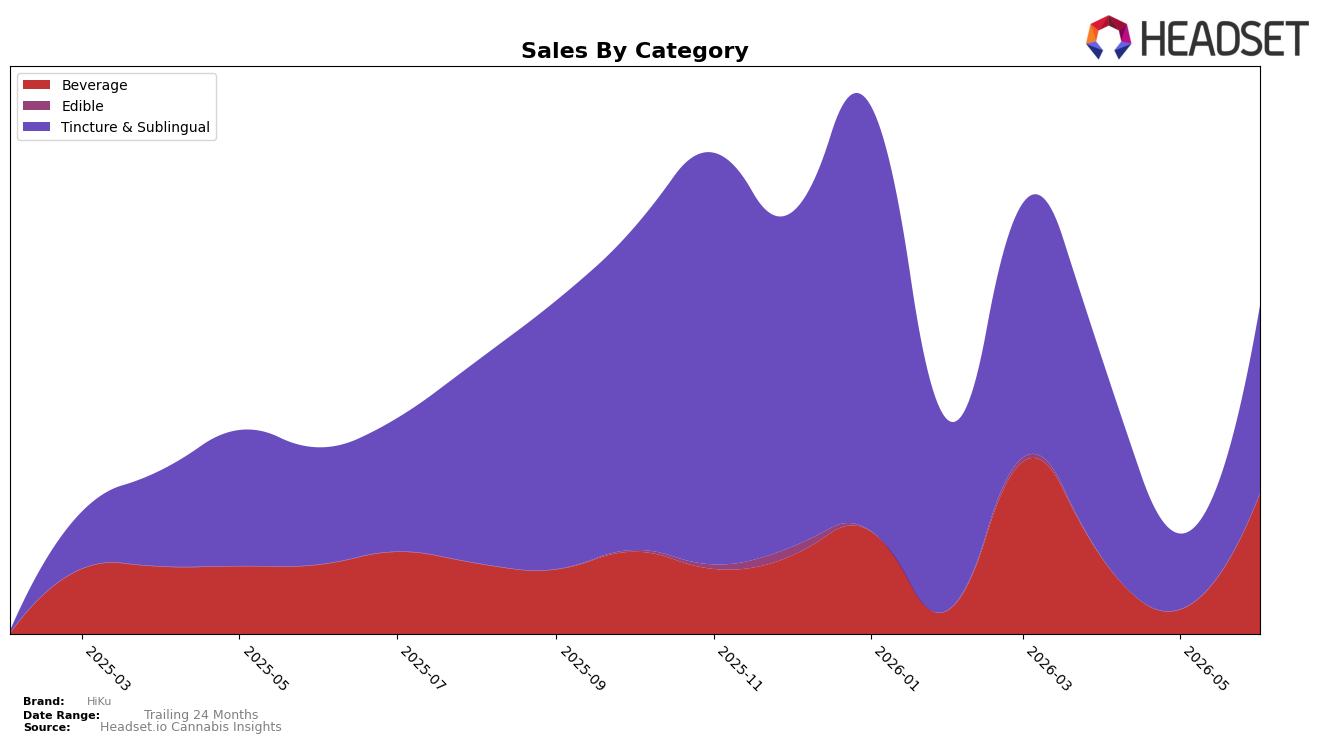
HiKu’s mix in June 2026 concentrated 57.12% of sales in Tincture & Sublingual with 42.88% in Beverage, while category growth moved unevenly: Tincture & Sublingual rose 60.52% year over year and 148.64% month over month, whereas Beverage expanded 102.80% year over year and 477.08% month over month. Despite an average price decline of 13.91% year over year to $3.27, Tincture & Sublingual carried a lower ticket at $3.10 versus Beverage at $3.52, and HiKu held rank 4 in Tincture & Sublingual in Washington. The pattern implies HiKu is pivoting toward faster-growing Beverage demand without ceding its Tincture & Sublingual base, using price elasticity to accelerate volume while maintaining category visibility through a top-5 rank.
The outsized 477.08% month-over-month surge in Beverage versus 148.64% in Tincture & Sublingual, alongside a 102.80% versus 60.52% year-over-year split, indicates a short-term acquisition channel in Beverage that is outpacing legacy formats. With overall brand sales up 76.28% year over year and Tincture & Sublingual still at 57.12% share, HiKu’s positioning leans hybrid: Beverage acts as the growth engine while Tincture & Sublingual sustains credibility and rank 4 access in Washington. The implication is that near-term share gains will likely accrue from Beverage line depth and distribution, while price architecture must preserve the $3.10–$3.52 spread to prevent cannibalization across the two categories.
Competitive Landscape
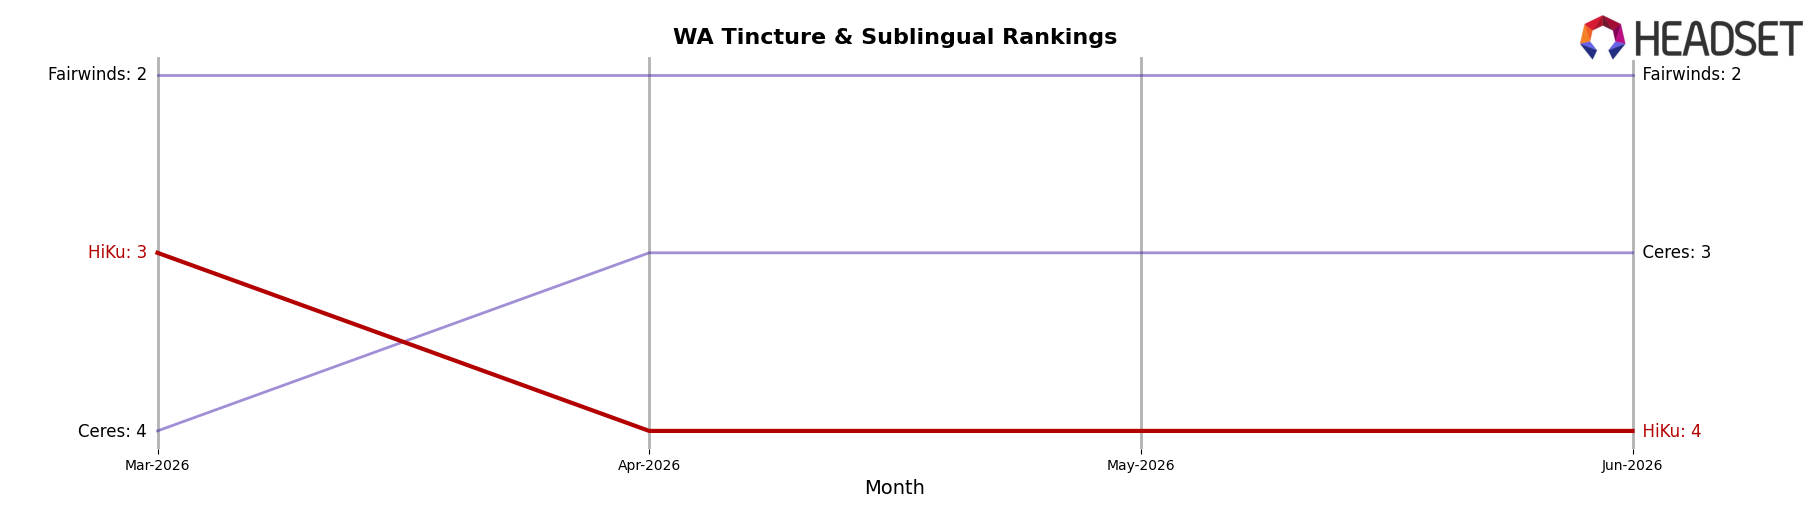
HiKu sits at rank #4 in WA Tincture & Sublingual for June 2026, unchanged from #4 in June 2025, while slipping from #3 in March 2026 to #4 in June 2026; in contrast, Green Revolution moved from #2 to #1 year over year as its sales fell 9.0%, and Fairwinds declined from #1 to #2 with a 19.8% sales drop. Relative position against Ceres tightened as Ceres held #3 year over year despite a 33.9% decline, while Canna Cantina stayed at #5 but expanded sales by 43.6%, indicating upward pressure from below; paired with HiKu’s peak at #3 in March 2026 and subsequent return to #4, the pattern implies a stable-but-squeezed middle slot where modest share losses to #3 and risk from a fast-rising #5 constrain upward mobility.
Notable Products
CBD/THC 1:4 Passion Orange Guava Distillate Drink Shot (25mg CBD, 100mg THC, 1oz, 30ml) posted the largest move in June 2026 at +546.9% MoM into rank 2, outpacing the CBD/THC 1:4 Lavender Lemonade Distillate Drink Enhancer (25mg CBD, 100mg THC, 1oz, 30ml) at +269.9% in rank 1. Across the top ten, six SKUs sit in Tincture & Sublingual while four are Beverages, and ranks 1, 4, 5, 7, 8, and 10 all posted MoM gains between +90.8% and +269.5%, which indicates the enhancer-led lineup is compounding faster than the shots despite one Beverage landing at rank 3. With no top-10 SKU reporting a decline and only two items carrying null MoM, the spread of +186.1% at rank 3 and +213.7% at rank 10 alongside a single-dollar anchor of $12,136 at rank 1 points to momentum concentrated in multi-cannabinoid enhancers rather than isolated formats. The product mix implies HiKu is orienting toward high-THC, ratioed drink enhancers as the commercial core, using flavor variety to pull Beverages along as secondary volume drivers.
Top Selling Cannabis Brands
Data for this report comes from real-time sales reporting by participating cannabis retailers via their point-of-sale systems, which are linked up with Headset’s business intelligence software. Headset’s data is very reliable, as it comes digitally direct from our partner retailers. However, the potential does exist for misreporting in the instance of duplicates, incorrectly classified products, inaccurate entry of products into point-of-sale systems, or even simple human error at the point of purchase. Thus, there is a slight margin of error to consider. Brands listed on this page are ranked in the top twenty within the market and product category by total retail sales volume.

