Jun-2026
Sales
Trend
6-Month
Product Count
SKUs
Avg Price
YoY Sales Change
YoY Price Change
Market Insights Snapshot
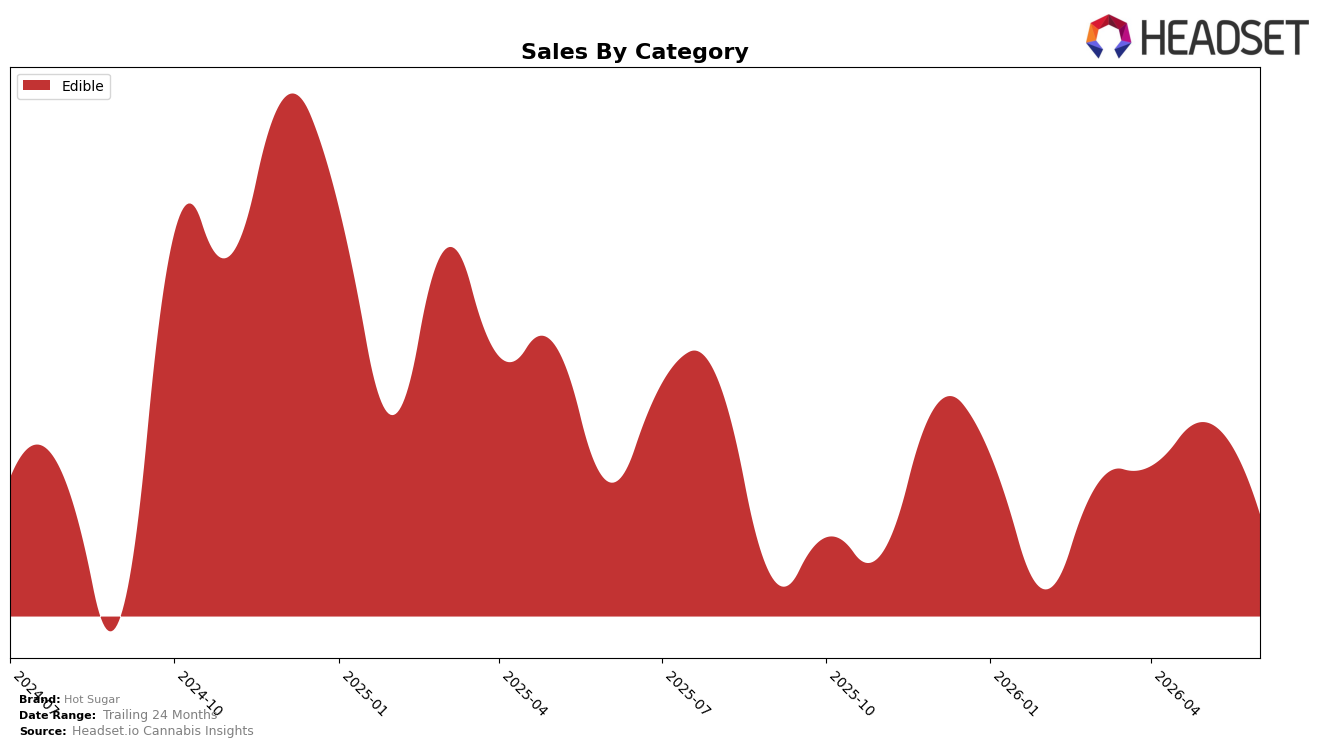
In June 2026, Hot Sugar operated as a single-category brand with Edible at 100.0% of sales, while brand sales declined 1.85% year over year and fell 5.07% month over month; the average price dropped 5.76% YoY to $8.61, concentrating volume in a lower-price mix. Holding rank 3 in Edible in Washington alongside a 1.20% two-year growth trend suggests stability in the core format even as short-term pricing pressure and a June volume dip reshape demand; the pattern implies the brand is trading on price elasticity within Edibles rather than on multi-category diversification.
The combination of a 5.07% MoM sales contraction and a 5.76% YoY price decrease, alongside a maintained rank position at 3 in Washington, implies Hot Sugar is defending share through tactical pricing rather than assortment breadth, which can cap upside if elasticities flatten. With 100.0% of revenue tied to Edible and only a 1.85% YoY sales decline offset by 1.20% growth over 24 months, the brand’s positioning skews toward value-led retention of existing Edible shoppers; the pattern implies near-term gains will rely on mix upgrades within Edibles (e.g., premium sub-lines or pack architecture) rather than expansion into adjacent categories.
Competitive Landscape
Hot Sugar sits at rank #3 in WA Edible in June 2026, unchanged from #3 in June 2025, while holding #3 as of March 2026 and matching its peak rank of #3 in June 2026; in contrast, Wyld held #1 year over year with a 7.3% YoY sales gain and Green Revolution held #2 with a 17.5% YoY increase, whereas Journeyman remained #4 and Craft Elixirs stayed #5 with a 1.2% YoY decline; the pattern implies Hot Sugar’s flat rank trajectory at #3 signals stable positioning but limited share capture against faster-growing leaders.

Notable Products
Peach Mango Fruit Drop 10-Pack (100mg) posted the standout move with a +151.5% month-over-month surge to rank 1, while Green Apple Fruit Drop 10-Pack (100mg) fell -14.4% at rank 4. Blue Raspberry Fruit Drop 10-Pack (100mg) also contracted -9.7% at rank 3, creating a split where top ranks mix a triple-digit gainer with mid-pack declines. This pattern implies the core Fruit Drop line is fragmenting around flavor winners, concentrating demand into fewer SKUs rather than lifting the whole set.
Nine of the top ten are Edible SKUs, and five of the top seven sit within gummy or fruit drop formats, indicating category density even as CBN/THC 1:1 Huckleberry Gummies 10-Pack (100mg CBN, 100mg THC) slid -17.0% at rank 9 and Indica Strawberry Live Resin Gummies 10-Pack (100mg) dipped -7.6% at rank 8. Indica Green Apple Live Resin Gummies 10-Pack (100mg) grew +6.8% at rank 5 against small declines of -2.2% to -5.1% among adjacent SKUs, compressing share toward a few winning flavor-effect pairings. The mix points to a near-term focus on scaling the highest-velocity flavor profiles while pruning weaker varieties to protect rank concentration.
Top Selling Cannabis Brands
Data for this report comes from real-time sales reporting by participating cannabis retailers via their point-of-sale systems, which are linked up with Headset’s business intelligence software. Headset’s data is very reliable, as it comes digitally direct from our partner retailers. However, the potential does exist for misreporting in the instance of duplicates, incorrectly classified products, inaccurate entry of products into point-of-sale systems, or even simple human error at the point of purchase. Thus, there is a slight margin of error to consider. Brands listed on this page are ranked in the top twenty within the market and product category by total retail sales volume.

