Jun-2026
Sales
Trend
6-Month
Product Count
SKUs
Avg Price
YoY Sales Change
YoY Price Change
Market Insights Snapshot
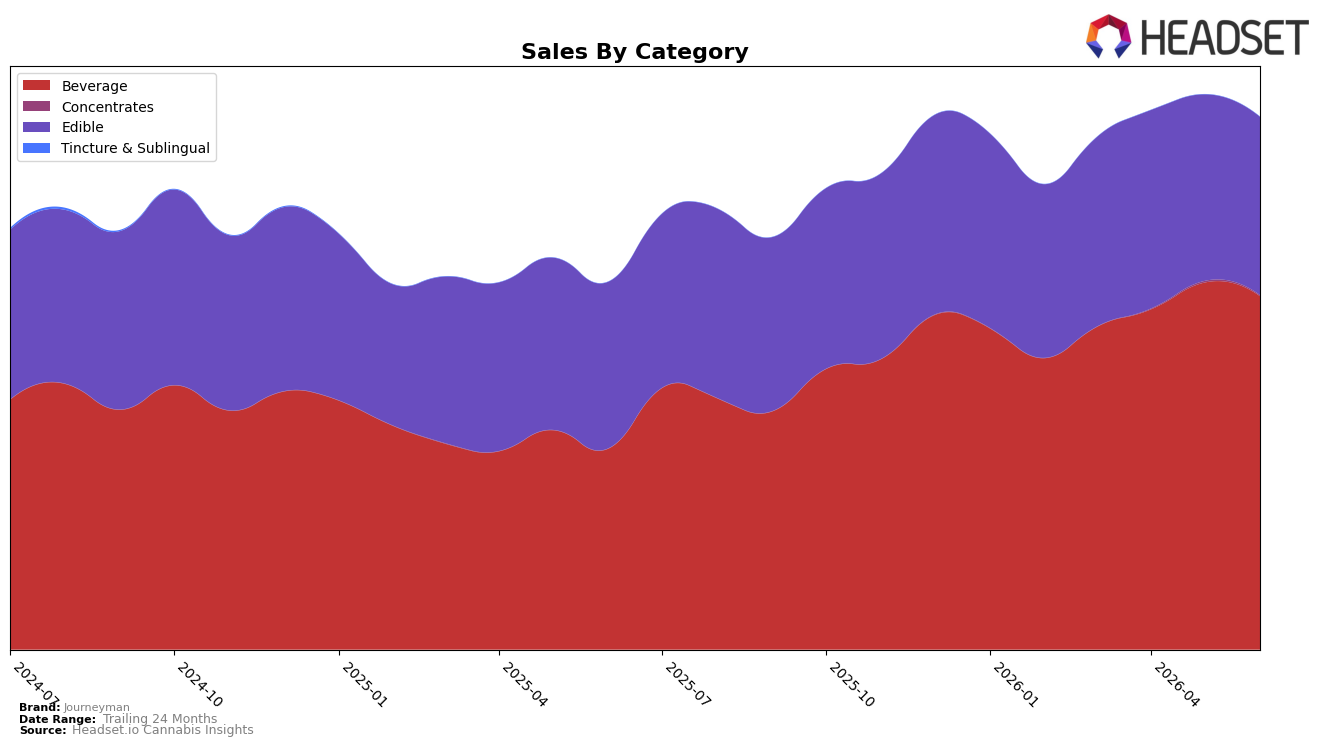
Journeyman’s mix in June 2026 is concentrated in Beverage at 66.40% share with year-over-year growth of 76.08% despite a month-over-month decline of 3.71%, while Edible holds 33.47% share with a 7.06% year-over-year increase and a 4.40% month-over-month decline; Concentrates is negligible at 0.13% share with a 46.51% month-over-month drop and no year-over-year baseline. Against a brand-level year-over-year sales gain of 44.98% and an average price rise of 7.24%, the category skew implies Beverage is the primary growth engine even as both major categories softened month-over-month, and the thesis is that Journeyman is consolidating around Beverage while Edible assumes a stabilizing, secondary role.
Holding rank 4 in Edible in Washington while Edible’s brand share sits at 33.47% indicates Journeyman competes near the top tier in that category even as its overall business tilts 66.40% toward Beverage, and the 7.06% Edible year-over-year growth versus 76.08% in Beverage sets a widening gap. With the brand’s 44.98% year-over-year sales growth outpacing the 7.24% price increase, the mix shift points to volume-led momentum anchored in Beverage, so the positioning thesis is that Journeyman is evolving into a Beverage-led house with Edible used to maintain rank credibility and shelf presence rather than to drive the next leg of growth.
Competitive Landscape
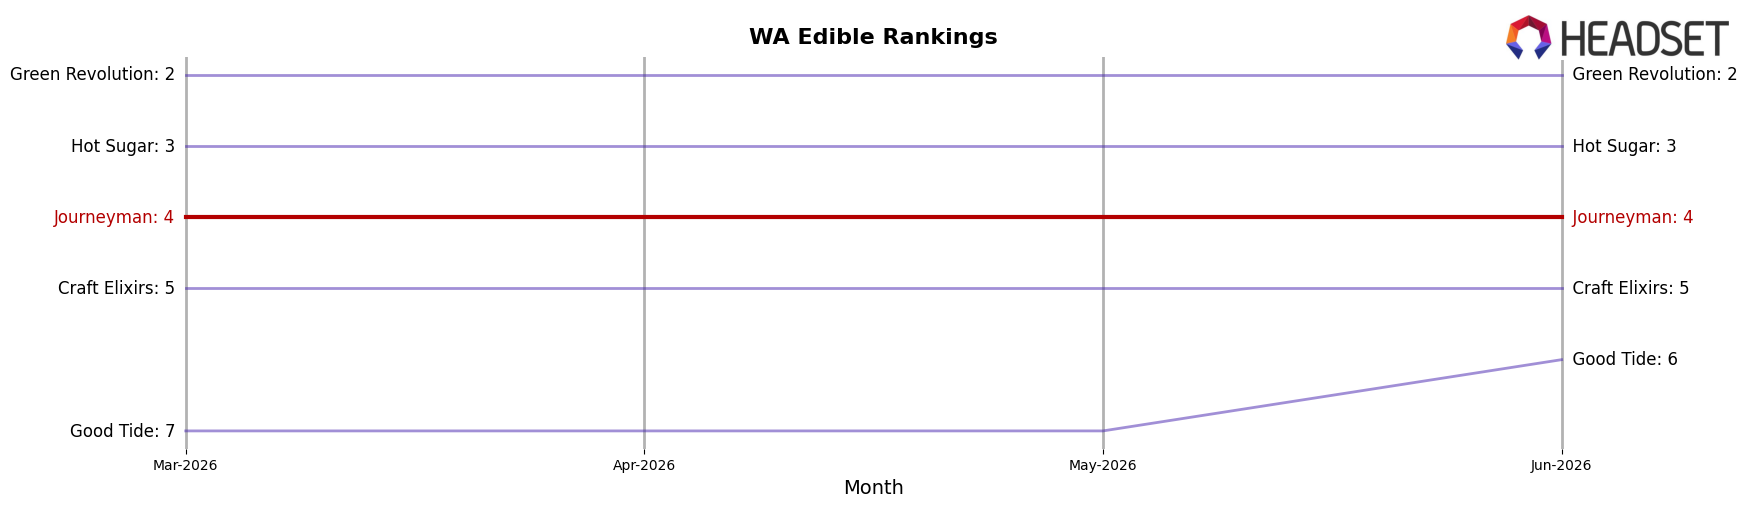
Journeyman sits at rank #4 in WA Edible for June 2026, unchanged year over year from rank #4, while category leaders show different momentum: Wyld held #1 with sales up 7.3% YoY and Green Revolution held #2 with sales up 17.5% YoY, whereas Hot Sugar maintained #3 with sales down 1.8% YoY and Craft Elixirs stayed #5 with sales down 1.2% YoY; the flat rank at #4 across June 2026 and the past three months indicates Journeyman is defending share against mixed competitor trajectories but not converting category growth above it into upward mobility, implying a stable but capped position unless relative growth accelerates.
Notable Products
Berry Lemonade (100mg THC, 2oz) posted the steepest decline at -18.48% MoM while sliding to rank 7, and Peach Lemonade Shot (100mg, 2oz, 59ml) fell -20.50% MoM at rank 10, together signaling softness in lower-ranked flavor extensions. In contrast, Pineapple Lemonade (100mg THC, 60ml, 2oz) inched up +6.07% MoM to hold rank 1 while Strawberry Lemonade Hash Rosin Lemonade (100mg THC, 60ml, 2oz) dipped -5.49% at rank 2, and eight of the top ten SKUs are Beverage lemonades, concentrating exposure in a single format. The pattern implies Journeyman is anchored by a leading flagship even as breadth within the lemonade portfolio is compressing at the tail, pointing to a need to rebalance mix toward a few high-velocity flavors and pack sizes.
Top Selling Cannabis Brands
Data for this report comes from real-time sales reporting by participating cannabis retailers via their point-of-sale systems, which are linked up with Headset’s business intelligence software. Headset’s data is very reliable, as it comes digitally direct from our partner retailers. However, the potential does exist for misreporting in the instance of duplicates, incorrectly classified products, inaccurate entry of products into point-of-sale systems, or even simple human error at the point of purchase. Thus, there is a slight margin of error to consider. Brands listed on this page are ranked in the top twenty within the market and product category by total retail sales volume.

