Market Insights Snapshot
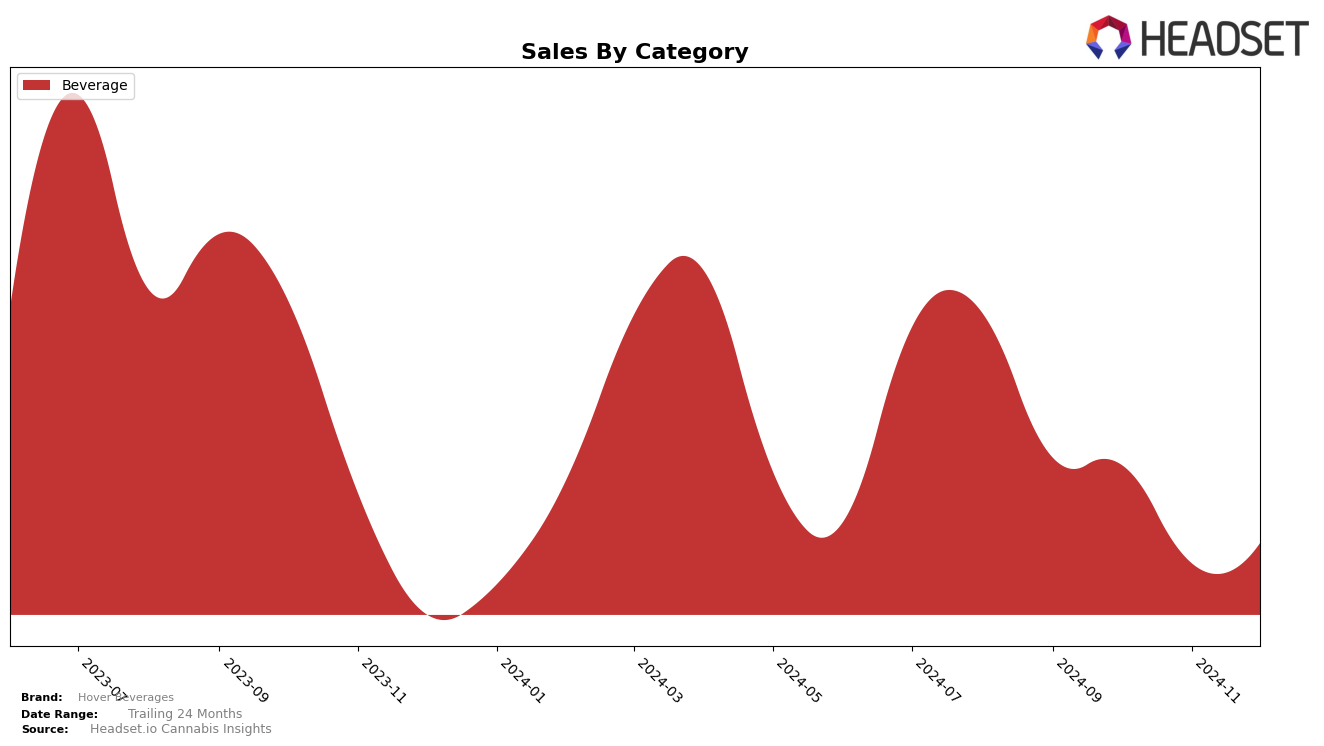
Hover Beverages has shown varied performance across different states and categories, particularly within the beverage sector. In Ontario, the brand maintained a presence in the top 30 rankings for the last quarter of 2024, albeit at the lower end of the spectrum. Starting at rank 25 in September, Hover Beverages slipped to rank 29 and held that position through December. This indicates a consistent, though not dominant, presence in the Ontario beverage market. The sales figures reflect a similar trend, with a notable dip in November followed by a slight recovery in December. This stability in rankings, despite fluctuating sales, might suggest a loyal customer base that sustains its market position.
However, the absence of Hover Beverages from the top 30 in other states or provinces could be a point of concern or a potential area for growth, depending on their strategic goals. The brand's ability to stay within the top 30 in Ontario suggests a foothold that could be leveraged for expansion into other regions. The data implies that while Hover Beverages has managed to stabilize its position in Ontario, there is significant room for improvement and potential growth in other markets. This performance review could serve as a catalyst for strategic planning, particularly in understanding market dynamics and consumer preferences in different regions.
Competitive Landscape
In the competitive landscape of the beverage category in Ontario, Hover Beverages has experienced a relatively stable yet challenging market position from September to December 2024. Despite maintaining a consistent rank of 29th in both November and December, Hover Beverages faced competition from brands like Ace Valley and Green Monke, which showed more dynamic rank changes. Notably, Green Monke saw a significant drop from 11th in October to 28th in December, indicating potential volatility or a shift in consumer preferences that Hover Beverages could capitalize on. Meanwhile, AMBR improved its rank from 30th in October to 26th in December, suggesting a growing market presence. Hover Beverages' sales figures, while consistent, showed a slight decline from October to November, but rebounded slightly in December, indicating a need for strategic marketing efforts to enhance brand visibility and capture market share from fluctuating competitors.

Notable Products
In December 2024, the top-performing product from Hover Beverages was the CBD/THC 1:1 Strawberry Starfruit Sparkling Beverage, which rose to the number one position with sales of 614 units. This product consistently held the second rank from September to November before claiming the top spot in December. The CBD/THC 1:1 Peach Mango High Sparking Beverage, previously ranked first from September to November, fell to second place in December. The CBD:THC 1:1 Lemon Iced Tea High Sparkling Beverages maintained a steady third place throughout the four months. The CBD/THC 1:1 Watermelon Sparkling Beverage remained in fourth place consistently, indicating a stable but lower preference compared to the other products.
Top Selling Cannabis Brands
Data for this report comes from real-time sales reporting by participating cannabis retailers via their point-of-sale systems, which are linked up with Headset’s business intelligence software. Headset’s data is very reliable, as it comes digitally direct from our partner retailers. However, the potential does exist for misreporting in the instance of duplicates, incorrectly classified products, inaccurate entry of products into point-of-sale systems, or even simple human error at the point of purchase. Thus, there is a slight margin of error to consider. Brands listed on this page are ranked in the top twenty within the market and product category by total retail sales volume.

