Jun-2026
Sales
Trend
6-Month
Product Count
SKUs
Avg Price
YoY Sales Change
YoY Price Change
Market Insights Snapshot
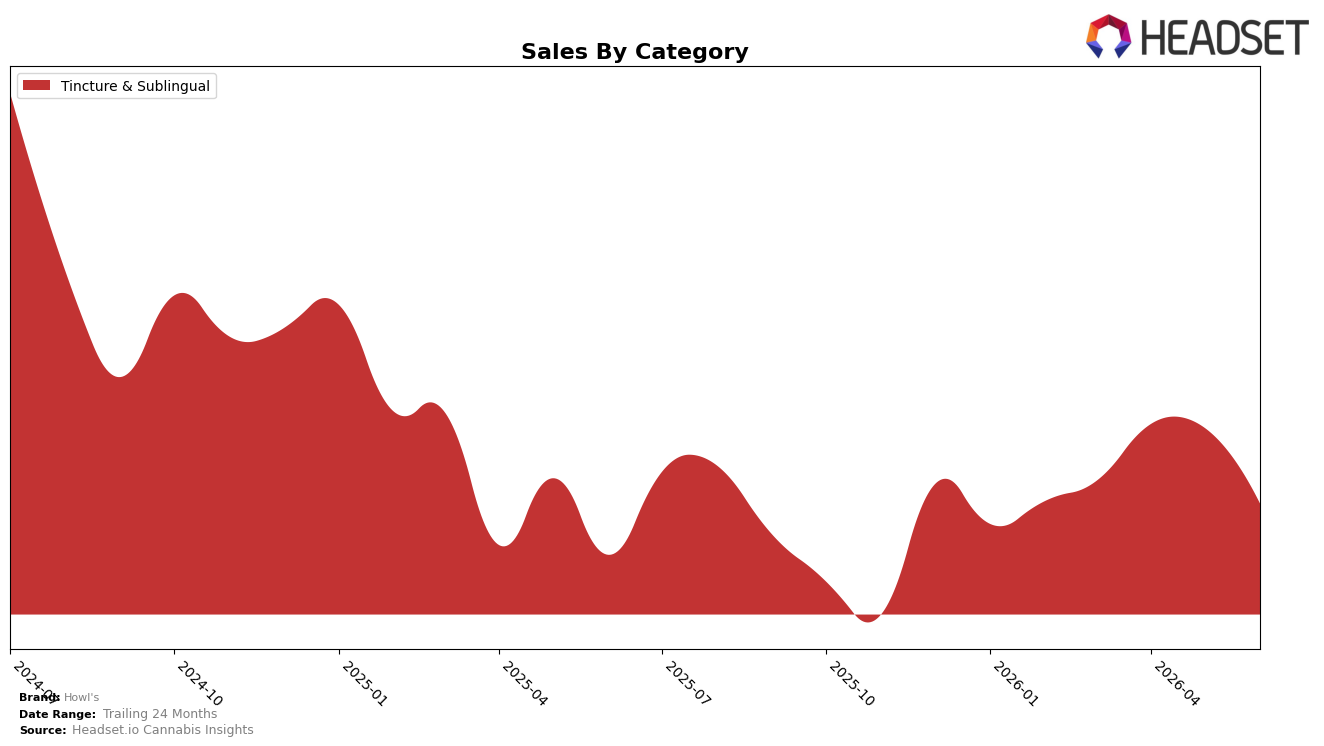
In June 2026, Howl's remained a single-category brand with Tincture & Sublingual accounting for 100.0% of sales, posting a year-over-year change of 22.6% alongside a month-over-month decline of 21.4%. The average price moved down 5.8% year over year to $69.08 while unit mix expanded enough to offset the price compression, and the 24‑month sales trend of -48.4% frames the current rebound as concentrated rather than broad-based. With a state-category rank of 4 in Massachusetts Tincture & Sublingual, the combination of +22.6% YoY growth and -21.4% MoM contraction implies a demand profile skewed toward episodic surges rather than steady monthly velocity.
The consolidation into Tincture & Sublingual at 100.0% share, paired with a -5.8% YoY price shift and a rank of 4 in Massachusetts, suggests Howl's is competing on accessible price points to maintain placement while ceding some short-term sell-through as indicated by the -21.4% MoM move. The contrast between +22.6% YoY growth and -48.4% over 24 months signals a brand positioned for tactical recoveries in a narrowed niche rather than diversified resilience, meaning current gains are likely tied to targeted promotions or buyer re-entry that may not persist without mix expansion or sustained pricing power.
Competitive Landscape
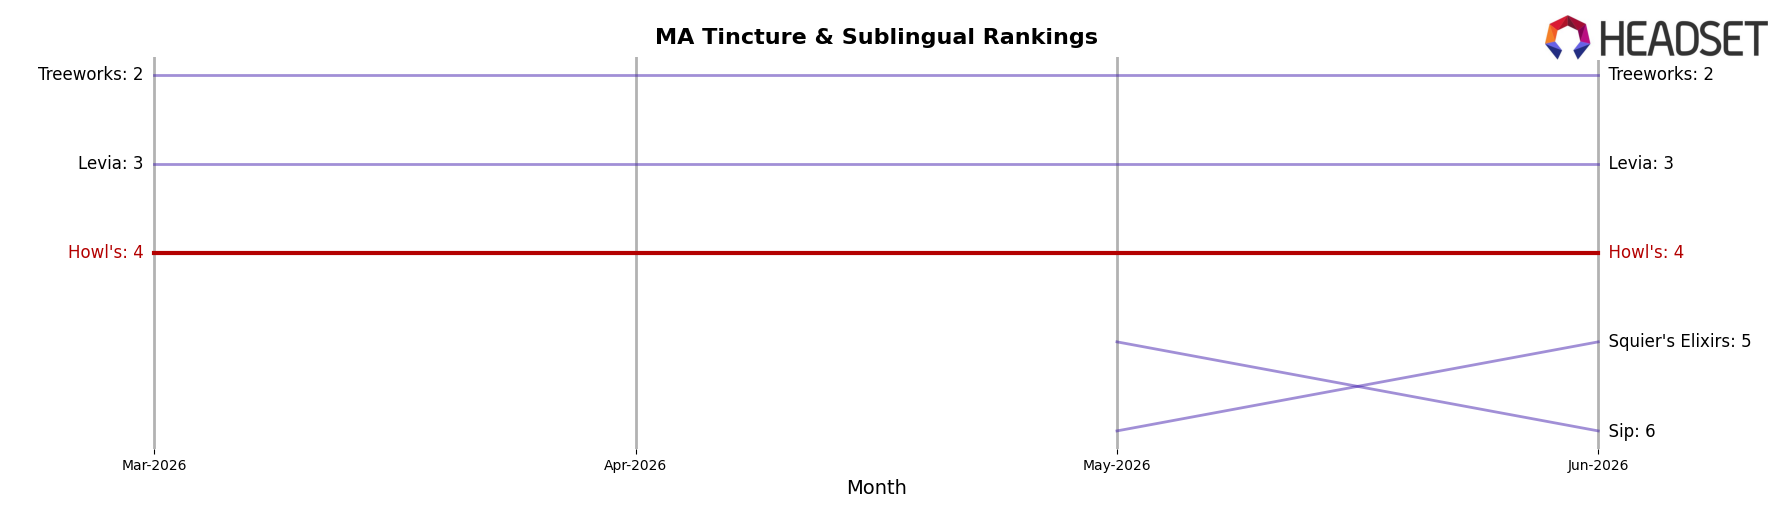
Howl's sits at rank #4 in Massachusetts Tincture & Sublingual for June 2026, unchanged from #4 year over year, and also flat versus three months ago at #4; this stability contrasts with Levia holding #3 with 126.68% YoY sales growth while remaining in place, and Squier's Elixirs advancing from #10 to #5 alongside 166.66% YoY sales growth, compressing the space immediately above and below Howl's. Meanwhile, category leader Good Feels Inc stayed at #1 despite a -7.83% YoY sales change, and Treeworks held #2 with a 29.82% YoY sales increase, indicating that static rank positions can mask divergent velocity; the implication is that Howl's flat rank at #4 signals a holding pattern amid faster-moving neighbors, raising the risk of downward pressure if adjacent growth trends persist.
Notable Products
The steepest movement in June 2026 was CBD/THC 10:1 High CBD Max Tincture (500mg CBD, 50mg THC,10ml) dropping 60.0% MoM while sliding outside the top five to rank 6, and CBD/THC 1:1 Temple Kush & Lifter (250mg CBD, 250mg THC, 1/3oz) fell 46.0% MoM at rank 5, signaling concentrated pullback in CBD-leaning SKUs. At the top, Anytime Max Temple Kush Tincture (500mg) held rank 1 despite a 12.1% MoM decline, and Daytime Max Tincture (500mg) sat at rank 2 with a 7.5% MoM dip, while Nighttime Tincture (500mg) plunged 38.7% MoM at rank 3. With all six listed SKUs in Tincture & Sublingual and the top four within the Max or Nighttime lines, the mix implies Howl's is leaning on a narrow tincture portfolio that is cycling down together, suggesting a need to broaden formats or rebalance CBD versus THC positioning.
Top Selling Cannabis Brands
Data for this report comes from real-time sales reporting by participating cannabis retailers via their point-of-sale systems, which are linked up with Headset’s business intelligence software. Headset’s data is very reliable, as it comes digitally direct from our partner retailers. However, the potential does exist for misreporting in the instance of duplicates, incorrectly classified products, inaccurate entry of products into point-of-sale systems, or even simple human error at the point of purchase. Thus, there is a slight margin of error to consider. Brands listed on this page are ranked in the top twenty within the market and product category by total retail sales volume.

