Jun-2026
Sales
Trend
6-Month
Product Count
SKUs
Avg Price
YoY Sales Change
YoY Price Change
Market Insights Snapshot
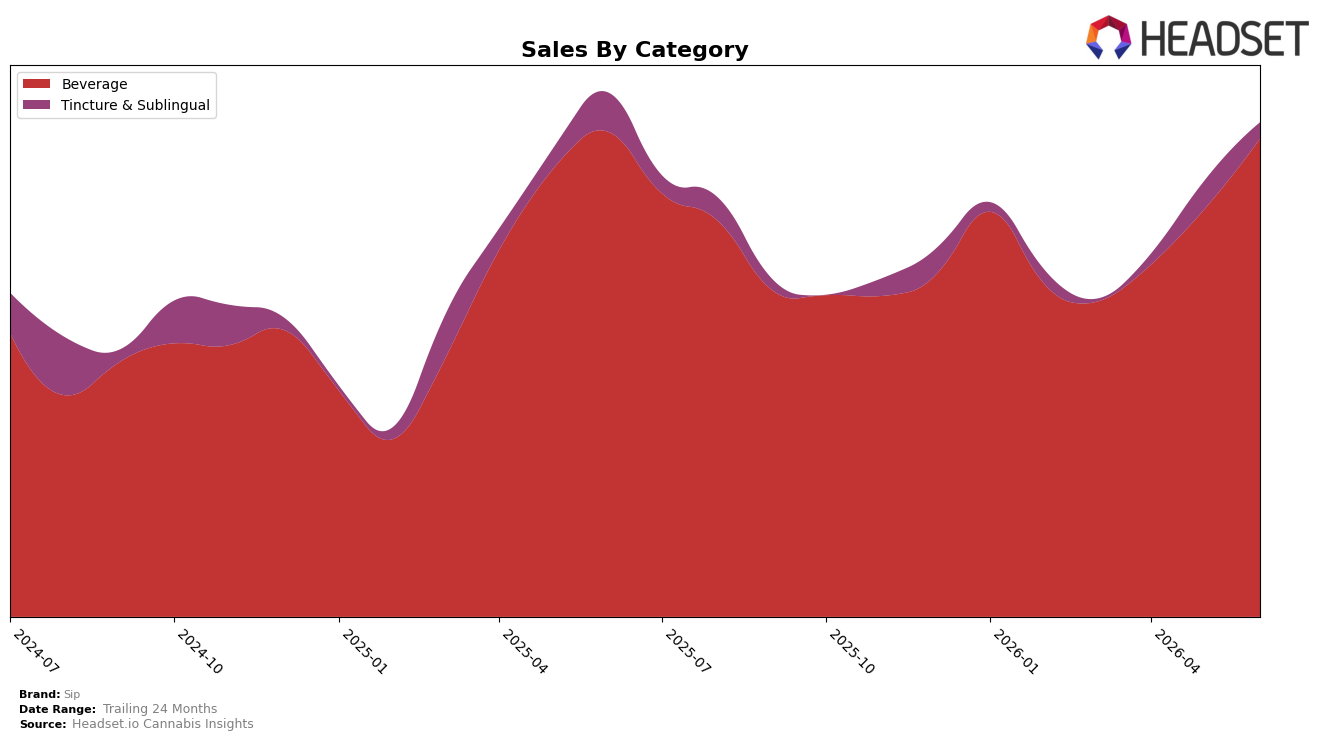
Sip concentrated 86.05% of June 2026 sales in Beverage with a 14.60% month-over-month lift, while Tincture & Sublingual held 13.95% share with a 12.02% month-over-month decline; year over year, Beverage dipped 1.24% and Tincture & Sublingual fell 20.42%. Despite a 16.93% year-over-year drop in average price to $4.19 and a brand-level year-over-year sales change of -4.45%, the category mix skewed further toward Beverage, and the brand ranked 7 in Beverage in Massachusetts. The pattern implies a deliberate volume-led push in Beverage offsetting contraction in Tincture & Sublingual, concentrating demand in one lane and trading price for share within the leading category.
With Beverage up 14.60% month over month and Tincture & Sublingual down 12.02% month over month while the overall average price fell 16.93% year over year, Sip is leaning into lower-ticket, higher-velocity Beverage to sustain throughput, evidenced by a higher June 2026 category concentration of 86.05% alongside a 1.24% year-over-year Beverage decline that is shallower than the 20.42% fall in Tincture & Sublingual. Holding the number 7 Beverage rank in Massachusetts while mix consolidates suggests priority on defending mid-tier placement via price-accessible Beverage formats rather than diversifying into premium sublinguals, implying future positioning anchored in scale within Beverage and reduced reliance on high-price ancillary categories.
Competitive Landscape
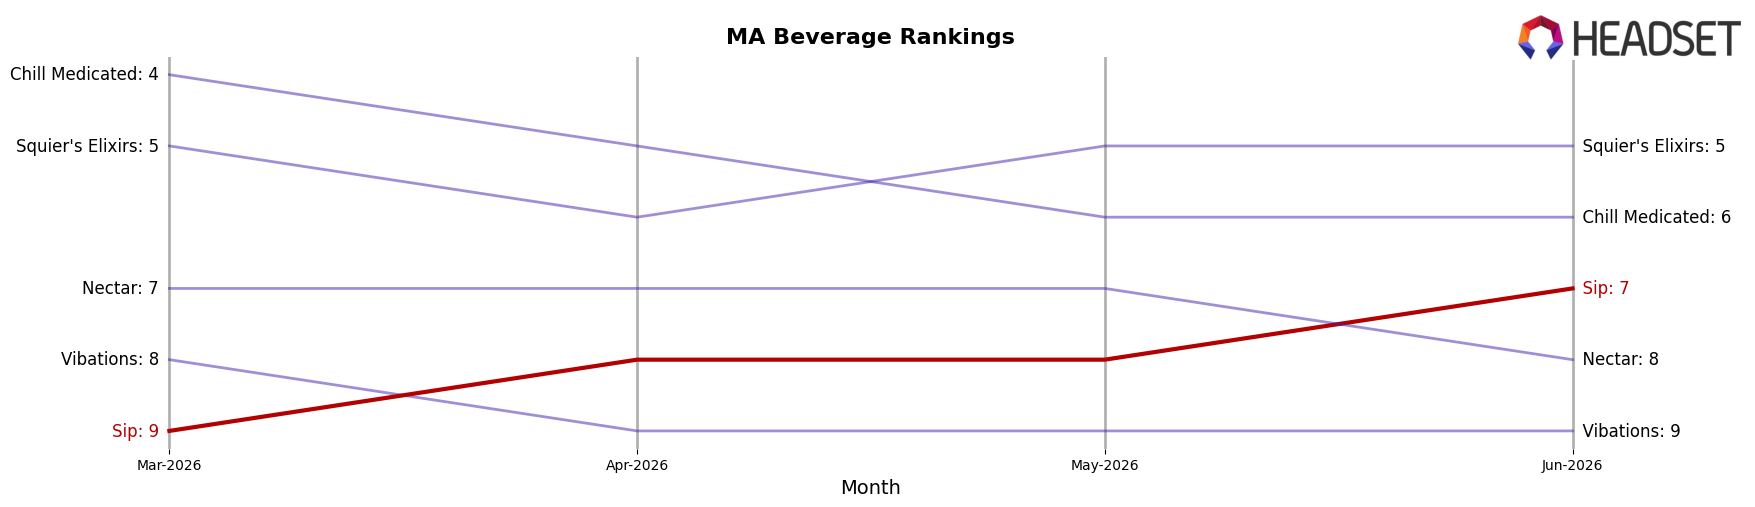
Sip is #7 in MA Beverage in June 2026, up 1 rank from #8 year over year and 2 ranks from #9 three months ago, while the category leader Levia held #1 both this year and last and Pine + Star advanced from #5 to #4 as its sales grew 13.30% year over year; in contrast, Buzzy stayed at #3 despite a -15.93% sales decline and Hi5 Seltzer maintained #2 with 31.95% growth, indicating that Sip’s incremental climb to a peak rank of #7 in June 2026 is tied less to broad category reshuffling and more to targeted share capture against mid-pack rivals that are moving slower or contracting.
Notable Products
CBD/THC 1:1 Half & Half Soda (5mg CBD, 5mg THC, 12oz, 355ml) posted the largest month-over-month gain at 80.6% and climbed into rank 8, while THC/CBG/THC Revive Pink Potion (5mg THC, 1mg CBG, 1mg CBC, 12oz, 355ml) rose 55.0% to rank 6. Energy - Orange Sugar-Free Soda (5mg THC, 12oz, 355ml) advanced 34.6% to hold rank 1, whereas Cranberry Highway Soda (5mg THC, 355ml) fell 17.4% to rank 5. Four of the top ten are sugar-free or low-sugar SKUs, and the mix shift toward functional or balanced CBD:THC formats suggests Sip is leaning into wellness-led beverages that can scale beyond a single seasonal flavor.
Top Selling Cannabis Brands
Data for this report comes from real-time sales reporting by participating cannabis retailers via their point-of-sale systems, which are linked up with Headset’s business intelligence software. Headset’s data is very reliable, as it comes digitally direct from our partner retailers. However, the potential does exist for misreporting in the instance of duplicates, incorrectly classified products, inaccurate entry of products into point-of-sale systems, or even simple human error at the point of purchase. Thus, there is a slight margin of error to consider. Brands listed on this page are ranked in the top twenty within the market and product category by total retail sales volume.

