Jun-2026
Sales
Trend
6-Month
Product Count
SKUs
Avg Price
YoY Sales Change
YoY Price Change
Market Insights Snapshot
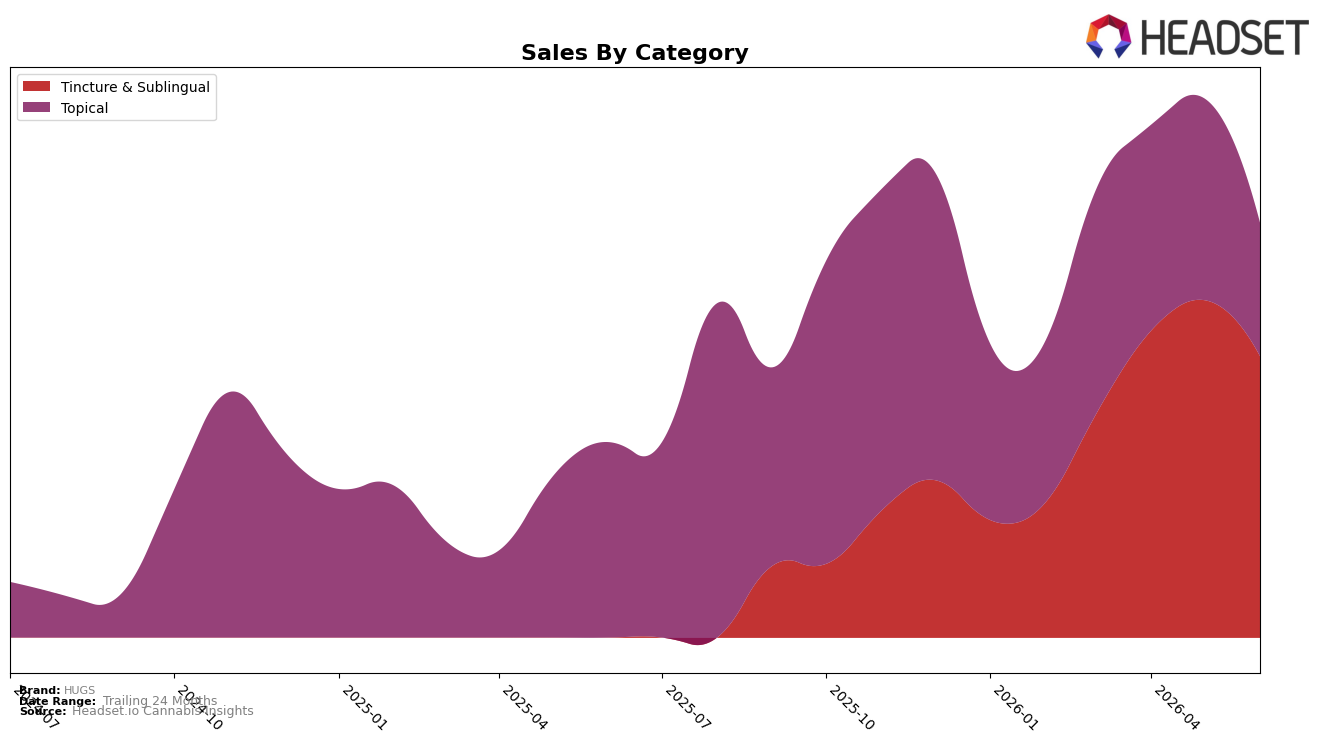
In June 2026, HUGS concentrated 67.86% of sales in Tincture & Sublingual with a month-over-month decline of 16.59%, while Topical held 32.14% share with a steeper 33.82% month-over-month drop; the category skew places HUGS at rank 5 in Tincture & Sublingual in Missouri, even as overall brand sales grew 112.47% year over year and average price fell 49.23% year over year. Within the mix, Topical’s year-over-year contraction of 31.72% contrasts with the unknown year-over-year trajectory for Tincture & Sublingual, pointing to a portfolio where gains are carried by lower-priced tincture items averaging $25.04 versus $57.96 in Topical; this pattern implies HUGS is leaning into value-priced tinctures to offset Topical softness and sustain rank 5 category presence.
The mix shift and price compression suggest HUGS is trading down to capture volume in Tincture & Sublingual, where a 16.59% month-over-month dip was materially lighter than Topical’s 33.82% decline, positioning the brand to defend share via price-accessible formats while Topical retrenches by 31.72% year over year. With 67.86% of sales anchored in Tincture & Sublingual and a 49.23% brand-level price decrease year over year, HUGS’s positioning tilts toward affordability over premium add-ons, implying that maintaining rank 5 in Missouri will depend on deepening tincture assortment and selectively pruning higher-priced Topical SKUs averaging $57.96.
Competitive Landscape
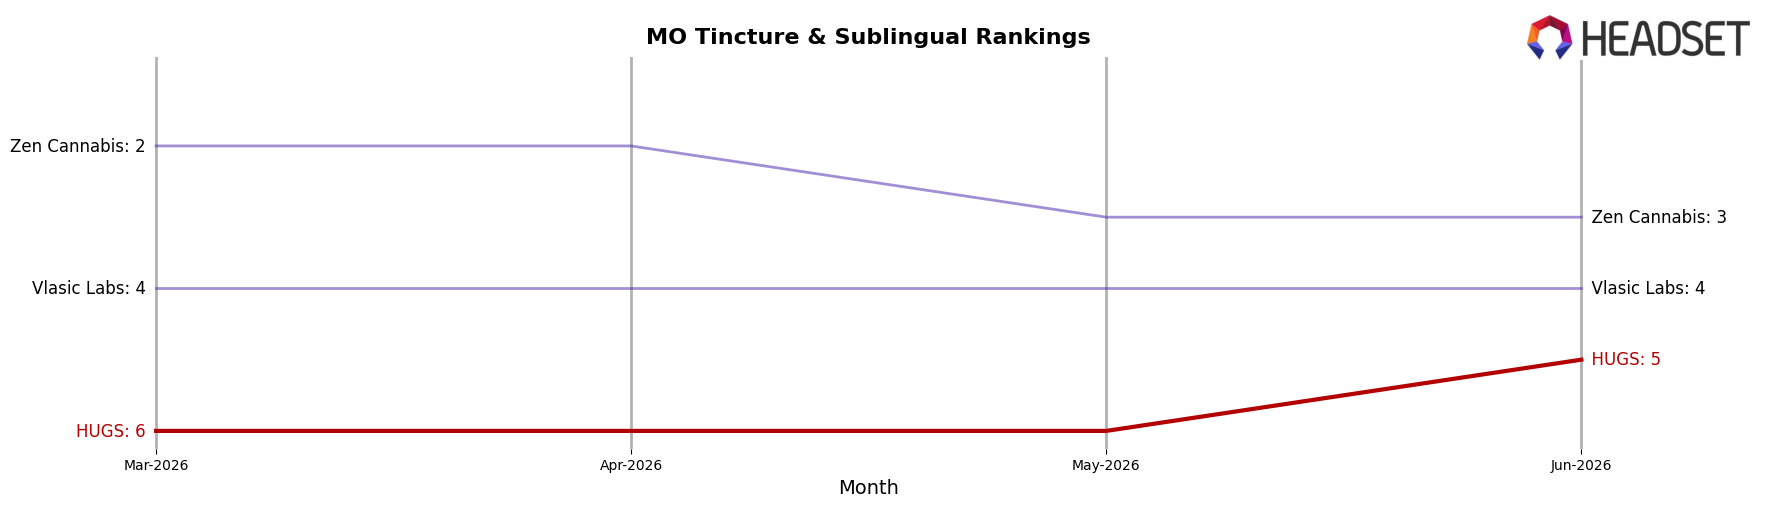
HUGS sits at rank #5 in Missouri Tincture & Sublingual in June 2026, improving 1 place from March 2026 when it was #6, and matching its peak rank of #5 also set in June 2026; while year-over-year rank is unavailable, category context shows Vivid (MO) holding #1 with a year-over-year sales change of +69.3% and Vlasic Labs sliding to #4 with a -30.3% sales change, indicating HUGS has advanced relative to at least one declining rival despite trailing Mary's Medicinals at #2. The combination of a 1-rank climb quarter-over-quarter and parity with its all-time best rank suggests HUGS is consolidating a mid-tier position that could pivot upward if it converts share from declining competitors or downward if faster growers like Zen Cannabis at #3 (+27.6% YoY sales) outpace it.
Notable Products
The steepest movement in June 2026 was the decline for Cannabis Salve (500mg), down 33.8% MoM while holding rank 3, signaling that Topical demand is soft even for high-visibility SKUs. Daytime Tincture (200mg THC) fell 14.4% MoM at rank 2 and Nighttime Tincture (200mg) dropped 22.3% at rank 4, while Peppermint Oral Spray (150mg) slipped 3.8% but remained rank 1 with $4,941, indicating relative resilience at the very top. Four of the top five are Tincture & Sublingual products whose combined rank positions (1, 2, 4, 5) contrast with their MoM declines between 3.8% and 34.2%, implying that HUGS’s leadership is concentrated in a category experiencing short-term contraction. The mix suggests HUGS is over-indexed in Tincture & Sublingual and may need adjacent-category reinforcements as volume consolidates into a single flagship SKU rather than broad-based growth.
Top Selling Cannabis Brands
Data for this report comes from real-time sales reporting by participating cannabis retailers via their point-of-sale systems, which are linked up with Headset’s business intelligence software. Headset’s data is very reliable, as it comes digitally direct from our partner retailers. However, the potential does exist for misreporting in the instance of duplicates, incorrectly classified products, inaccurate entry of products into point-of-sale systems, or even simple human error at the point of purchase. Thus, there is a slight margin of error to consider. Brands listed on this page are ranked in the top twenty within the market and product category by total retail sales volume.

