Market Insights Snapshot
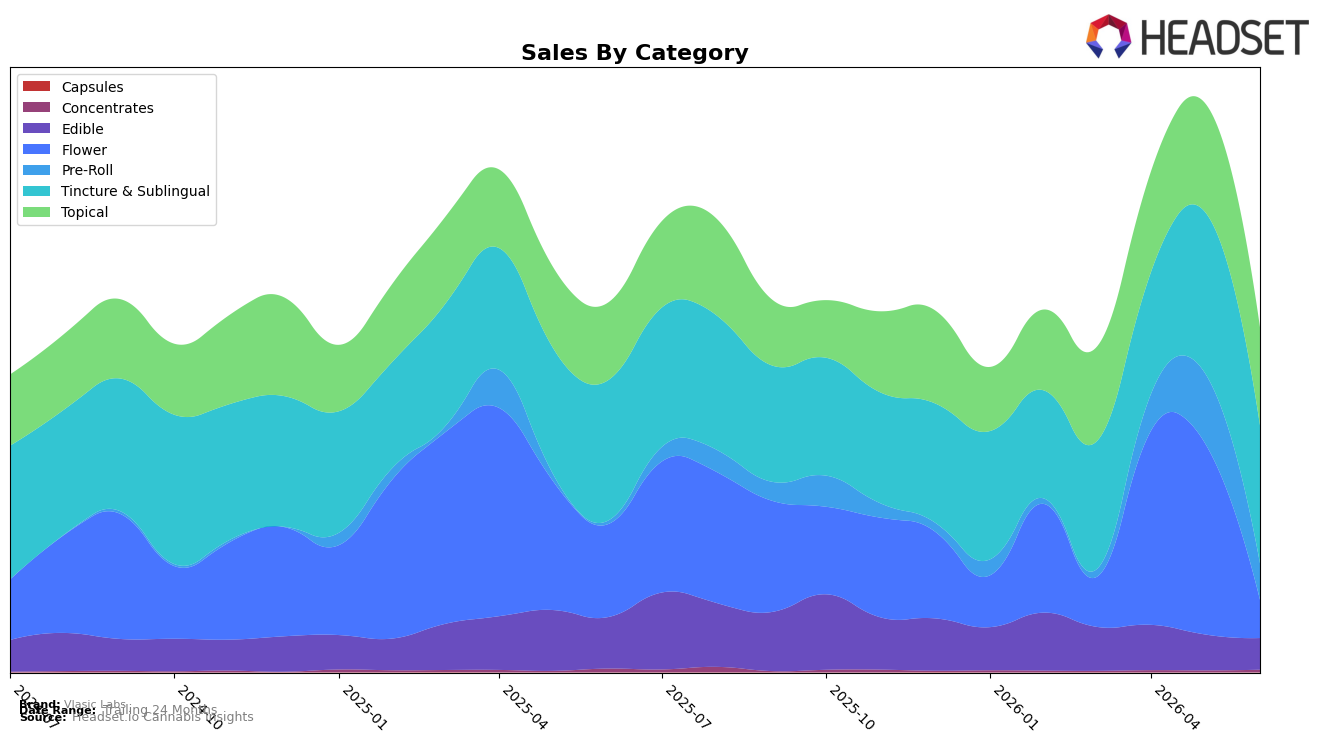
In June 2026, Vlasic Labs leaned on Tincture & Sublingual at a 40.05% share while Topical held 28.47%, but both core lanes softened month over month with Tincture & Sublingual down 14.40% and Topical down 9.88%; year over year, Tincture & Sublingual slipped 1.72% while Topical rose 26.33%. Volatile smaller bets pulled in opposite directions: Pre-Roll posted a 980.94% year-over-year jump yet fell 48.12% month over month to 10.53% share, and Flower collapsed 58.97% year over year and 80.13% month over month to 11.06% share. The combination of a 32.04% year-over-year average price drop and a 6.73% brand-level sales decline, alongside a #1 rank in Tincture & Sublingual in Michigan, implies the current mix is pricing down to defend category leadership while accepting sharp volume variability in peripheral formats.
The mix shift suggests deliberate concentration: maintaining a #1 position in Tincture & Sublingual while allowing high-variance categories to serve as opportunistic volume swings, evidenced by Concentrates rising 35.84% month over month at just 0.72% share and Edible contracting 11.98% month over month with a 38.64% year-over-year decline. With Topical’s 26.33% year-over-year growth counterbalancing Tincture & Sublingual’s 1.72% year-over-year dip, the portfolio is anchoring on two wellness-adjacent formats while trimming exposure to Flower’s 80.13% month-over-month fall and Pre-Roll’s 48.12% month-over-month retrenchment; the implication is that Vlasic Labs’s positioning favors defensible, higher-intent use cases over commoditized inhalables, using price elasticity to sustain share even as total brand sales recede 6.73% year over year.
Competitive Landscape
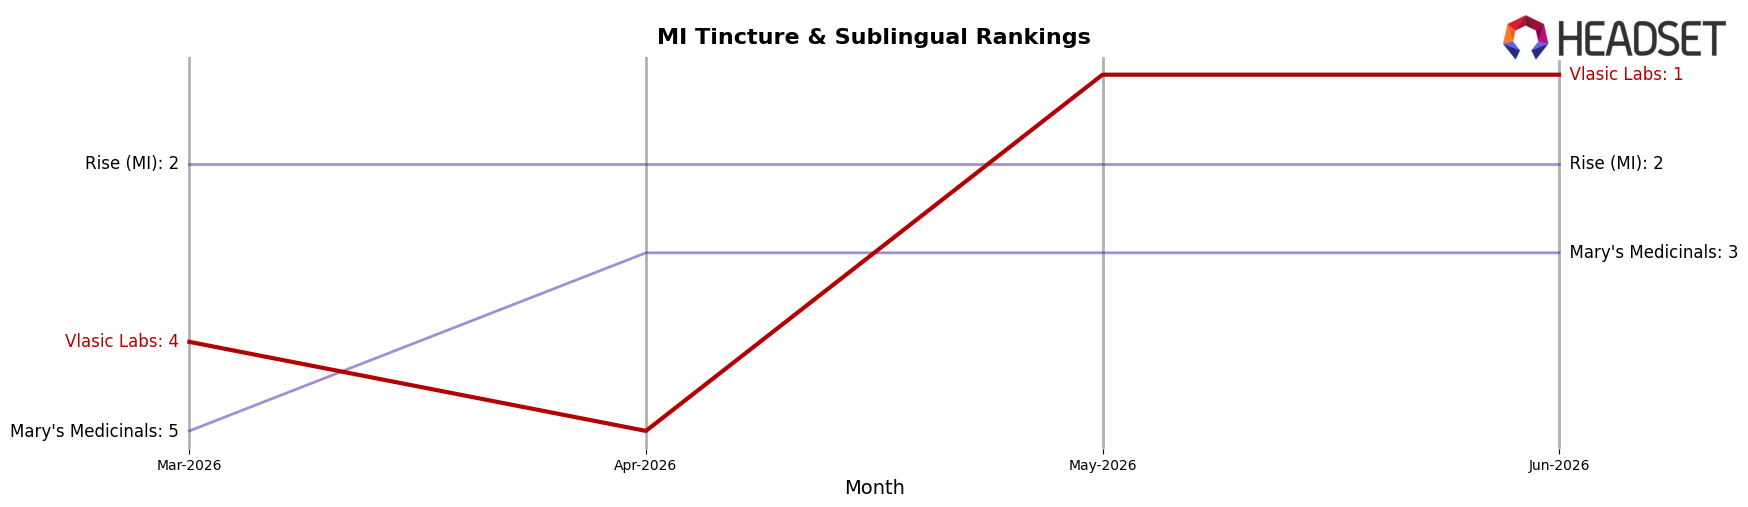
Vlasic Labs is ranked #1 in MI Tincture & Sublingual in June 2026, up 2 positions from #3 year over year and rising 3 positions from #4 in March 2026, marking a peak at #1 in June 2026; in contrast, Rise (MI) sits at #2 after falling from #1 year over year with a 55.5% sales decline, while Mary's Medicinals moved up to #3 from #4 alongside a 14.2% sales increase. Additionally, Treetown slid to #4 from #2 with a 33.3% sales drop, and KSHN Pouch Co. holds #5 without a reported year-over-year rank, indicating that Vlasic Labs’ ascent to #1 is tied less to broad market expansion and more to incremental share capture amid competitor retrenchment, a trajectory that implies continued top-tier positioning so long as competitor recovery remains muted.
Notable Products
Katsu Bubba Pre-Roll (1g) delivered the largest month-over-month gain at +89.5% while jumping to rank 1, and the CBD Broad Spectrum Tincture (3000mg CBD, 30ml, 1oz) fell -18.4% to rank 3; together these shifts indicate spend is rotating from tinctures toward ready-to-use inhalables. With Screwdriver Pre-Roll (1g) up +19.6% at rank 2, two of the top three are Pre-Roll SKUs, concentrating demand in a single format even as the CBD Full Spectrum Relief Cream (3000mg CBD, 3oz) slipped -10.0% at rank 4 and the CBG Isolate Mood Tincture (1800mg CBG, 30ml, 1oz) declined -16.7% at rank 5. The $38,709 in June 2026 sales for the CBD Broad Spectrum Tincture paired with its rank loss versus surging Pre-Roll ranks 1–2 implies Vlasic Labs is tilting its revenue mix toward faster-turn convenience formats at the expense of higher-dosage wellness SKUs.
Top Selling Cannabis Brands
Data for this report comes from real-time sales reporting by participating cannabis retailers via their point-of-sale systems, which are linked up with Headset’s business intelligence software. Headset’s data is very reliable, as it comes digitally direct from our partner retailers. However, the potential does exist for misreporting in the instance of duplicates, incorrectly classified products, inaccurate entry of products into point-of-sale systems, or even simple human error at the point of purchase. Thus, there is a slight margin of error to consider. Brands listed on this page are ranked in the top twenty within the market and product category by total retail sales volume.

