Jun-2026
Sales
Trend
6-Month
Product Count
SKUs
Avg Price
YoY Sales Change
YoY Price Change
Market Insights Snapshot
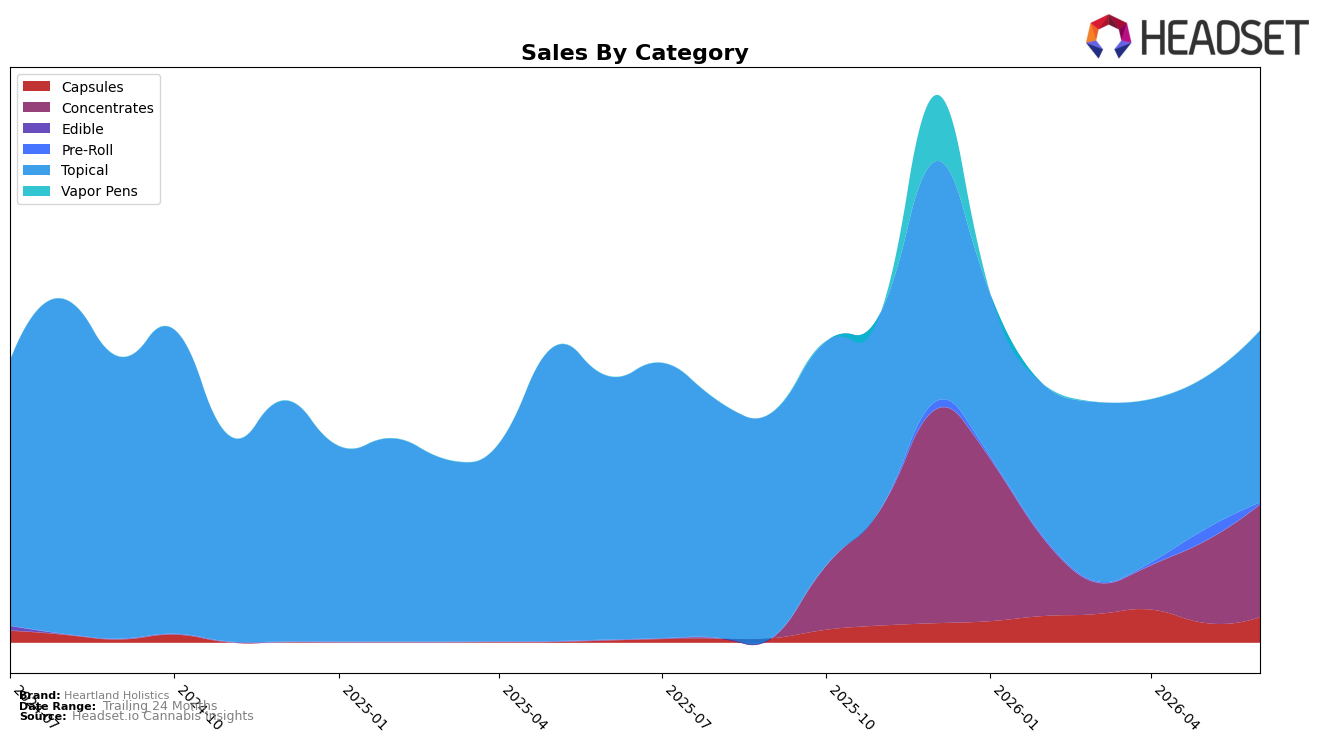
Heartland Holistics concentrated 55.25% of June 2026 sales in Topical, where sales were down 34.79% year over year but up 13.16% month over month, while Concentrates expanded to 36.12% share with a 38.40% month-over-month lift and no reported year-over-year baseline. Capsules jumped to 8.17% share with a 1,193.50% year-over-year increase and 29.53% month-over-month growth, whereas Pre-Roll slipped to 0.46% share with an 87.32% month-over-month decline and no year-over-year figure. Despite a 25.64% year-over-year rise in average price and 17.16% brand-level sales growth, the negative Topical comp alongside rapid Capsules and Concentrates gains indicates the mix is pivoting toward higher-priced formats even as the legacy Topical anchor softens.
With Topical still the largest piece at 55.25% but carrying a -34.79% year-over-year drag, the 38.40% month-over-month surge in Concentrates and the 1,193.50% year-over-year leap in Capsules suggest near-term positioning is shifting toward potency-led and wellness-use cases where average prices are 31.27 and 20.09, respectively. Holding rank 6 in Topical in Missouri while Topical rebounds 13.16% month over month implies the brand’s path to defensible differentiation is to sustain the Topical base for traffic while reallocating shelf and promo weight into Concentrates and Capsules, where sequential growth outpaces the Topical recovery and can support margin accretion.
Competitive Landscape
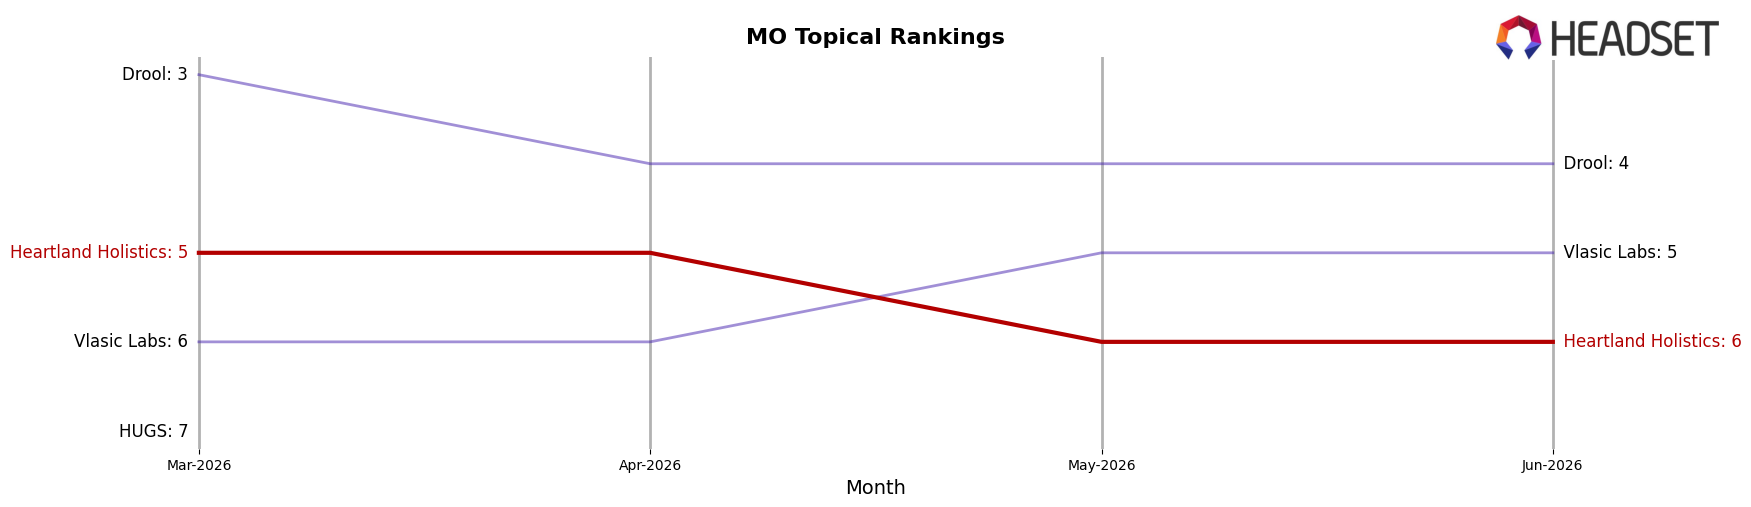
Heartland Holistics sits at rank #6 in MO Topical in June 2026, down 2 positions year over year from #4 and slipping 1 spot since March 2026 from #5, while its peak of #3 in January 2025 marks a 3-rank drop from that high; against this, Mary's Medicinals held #1 year over year with a -2.9% sales change and Escape Artists stayed at #2 despite a -41.8% sales decline, indicating Heartland Holistics’ relative position eroded even as top-tier rivals either held or deteriorated. With Drool climbing from #5 to #4 alongside a 14.0% sales increase and Vlasic Labs improving from #6 to #5 with a 16.7% gain, the immediate competitive pressure is coming from below, implying that Heartland Holistics’ downward rank trajectory points to share being ceded to mid-pack climbers rather than to entrenched leaders.
Notable Products
CBD/CBN/THC 1:1:1 Night Time Transdermal Patch (25mg CBD, 25mg CBN, 25mg THC) led June 2026 with a 73% month-over-month jump to rank 1, while CBD/THC 1:1 Herbal Relief Salve (150mg CBD, 150mg THC) surged 70% yet sat lower at rank 6, indicating demand is concentrating in sleep-oriented delivery rather than general relief. In contrast, CBD/THC/CBG 1:2:2 Morning Transdermal Patch (10mg CBD, 20mg THC, 20mg CBG) fell 26% to rank 5 and the 12hr Extended Release FECO Transdermal Patch (50mg) slipped 7% at rank 2, so morning and extended-release formats ceded share to nighttime recovery use. Four of the top ten are Topical SKUs, and with the FECO Transdermal Patch (60mg) up 15% at rank 3 alongside two declines in other patches, the category is bifurcating between recovery-centric and daytime utility. The pattern implies Heartland Holistics is tilting toward symptom-specific Topicals anchored on sleep and recovery, using high-growth flagship patches to pull shoppers even as broader FECO and morning formats fragment.
Top Selling Cannabis Brands
Data for this report comes from real-time sales reporting by participating cannabis retailers via their point-of-sale systems, which are linked up with Headset’s business intelligence software. Headset’s data is very reliable, as it comes digitally direct from our partner retailers. However, the potential does exist for misreporting in the instance of duplicates, incorrectly classified products, inaccurate entry of products into point-of-sale systems, or even simple human error at the point of purchase. Thus, there is a slight margin of error to consider. Brands listed on this page are ranked in the top twenty within the market and product category by total retail sales volume.

