Market Insights Snapshot
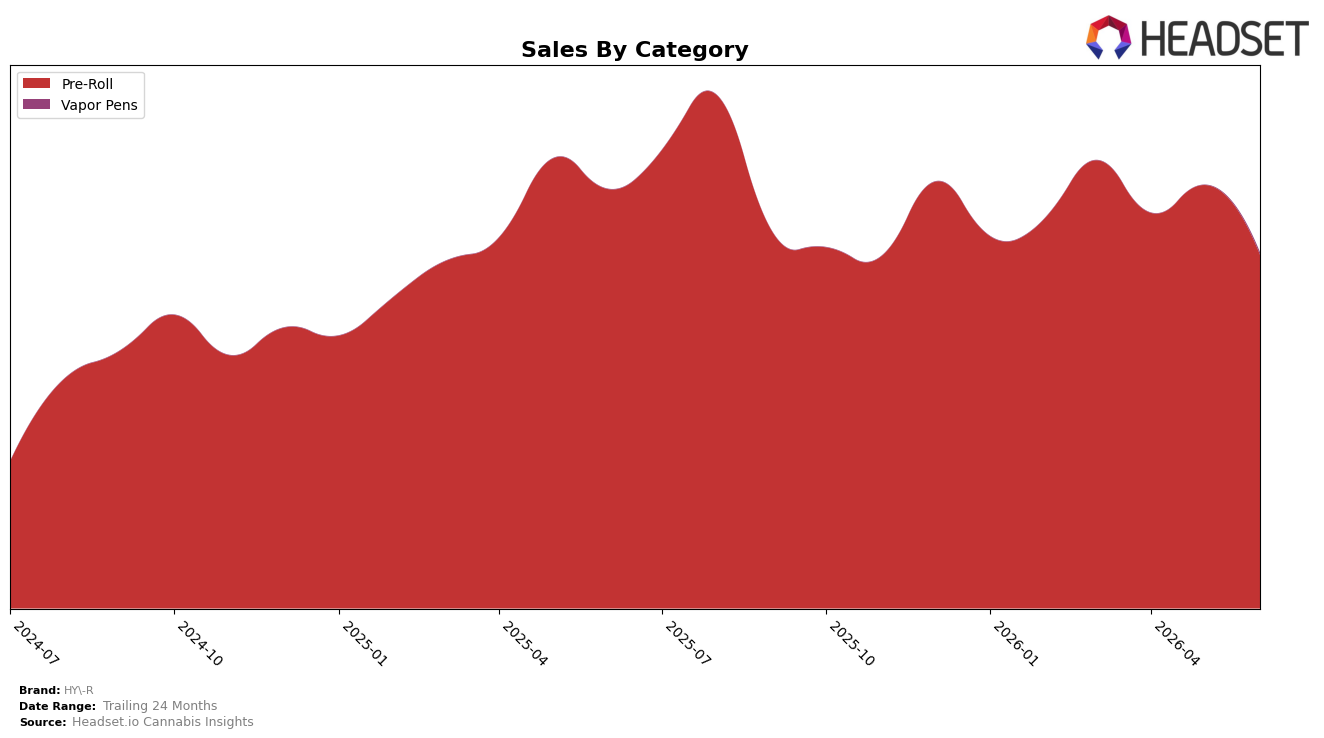
HY-R’s mix in June 2026 was overwhelmingly concentrated in Pre-Roll at 99.38% share, with Vapor Pens at 0.62% share, implying an increasingly single-category profile as Pre-Roll sales declined 15.69% year over year and 16.51% month over month. Despite a 4.72% year-over-year increase in average price to $7.89, the brand’s total sales fell 15.17% year over year, while Pre-Roll still held rank 9 in Michigan Pre-Roll, indicating volume pressure rather than price-led deterioration. This pattern implies HY-R’s exposure is concentrated in a shrinking Pre-Roll contribution for June 2026, with limited offset from Vapor Pens and a stable-but-midfield rank position.
The near-total reliance on Pre-Roll alongside a 16.51% month-over-month pullback and a rank of 9 in Michigan suggests the brand is positioned as a price-stable but volume-sensitive player whose share can erode quickly when category demand softens. With Vapor Pens contributing only 0.62% and no month-over-month or year-over-year momentum recorded, the existing portfolio offers little hedge against Pre-Roll volatility, implying that sustaining or improving June 2026 positioning will require either recapturing Pre-Roll velocity or allocating mix toward a second category to dilute single-category risk.
Competitive Landscape
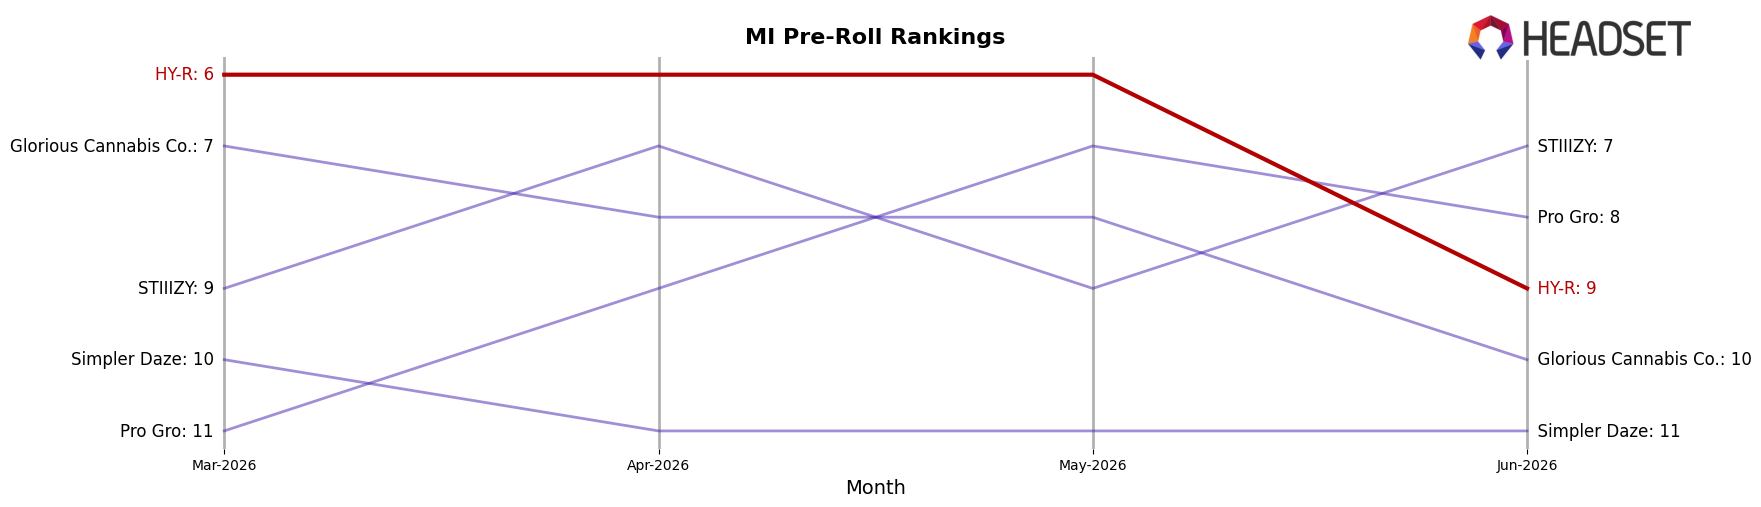
HY-R is ranked #9 in Michigan Pre-Roll for June 2026, down 3 positions year over year from #6, and 3 positions lower than its peak at #6 in May 2026; this contrasts with Jeeter holding at #1 year over year while posting a -7.9% sales change and Mitten Extracts climbing from #8 to #4 with a 114.4% year-over-year sales increase, indicating relative share is migrating toward faster risers. The 3-position decline since May 2026 alongside competitors like Cali-Blaze steady at #2 despite a -33.1% sales change and Dragonfly Cannabis stable at #3 with a 13.7% increase suggests distribution or velocity headwinds concentrated in late-quarter weeks; the thesis is that HY-R’s downward rank trajectory implies retention pressure in core accounts unless mix or promo cadence is reset to counter faster-moving competitors.
Notable Products
Kiwi Pie Infused Pre-Roll (1g) sets the tone with a -16.6% month-over-month drop to rank 2 while Blueberry Crumble Liquid Diamonds Infused Pre-Roll (1g) held rank 1 despite a -6.5% decline, implying top-heavy reliance with softening velocity at the peak. Cherry Punch Infused Pre-Roll (1g) fell -12.7% at rank 5 and Green Apple Infused Pre-Roll (1g) slid -16.3% at rank 10, while Jollyz Liquid Diamond Infused Pre-Roll (1g) was the lone mover up at +9.7% to rank 6, indicating mixed pull-through beneath the lead SKU. Eight of the top ten are Pre-Roll SKUs within a single infused sub-style, and with only one SKU posting positive MoM change, HY-R is consolidating around infused pre-rolls but facing breadth risk if the top ranks continue to contract. The pattern implies HY-R’s commercial direction is concentrated on infused pre-roll dominance, but near-term growth likely depends on reigniting momentum beyond the lead SKU rather than further depth in the same family.
Top Selling Cannabis Brands
Data for this report comes from real-time sales reporting by participating cannabis retailers via their point-of-sale systems, which are linked up with Headset’s business intelligence software. Headset’s data is very reliable, as it comes digitally direct from our partner retailers. However, the potential does exist for misreporting in the instance of duplicates, incorrectly classified products, inaccurate entry of products into point-of-sale systems, or even simple human error at the point of purchase. Thus, there is a slight margin of error to consider. Brands listed on this page are ranked in the top twenty within the market and product category by total retail sales volume.

