.svg)

Sep-2026
Sales
Trend
6-Month
Product Count
SKUs
Avg Price
YoY Sales Change
YoY Price Change


Where to Buy
In House is stocked at 508 licensed dispensaries across Massachusetts, Illinois, and 9 other states, 186 of them in Massachusetts, with the deepest coverage in Boston, Worcester, Fall River, Northampton, and Springfield. Search by ZIP code or city below to find the closest one, or filter by product type if you are after a specific format.
Market Insights Snapshot
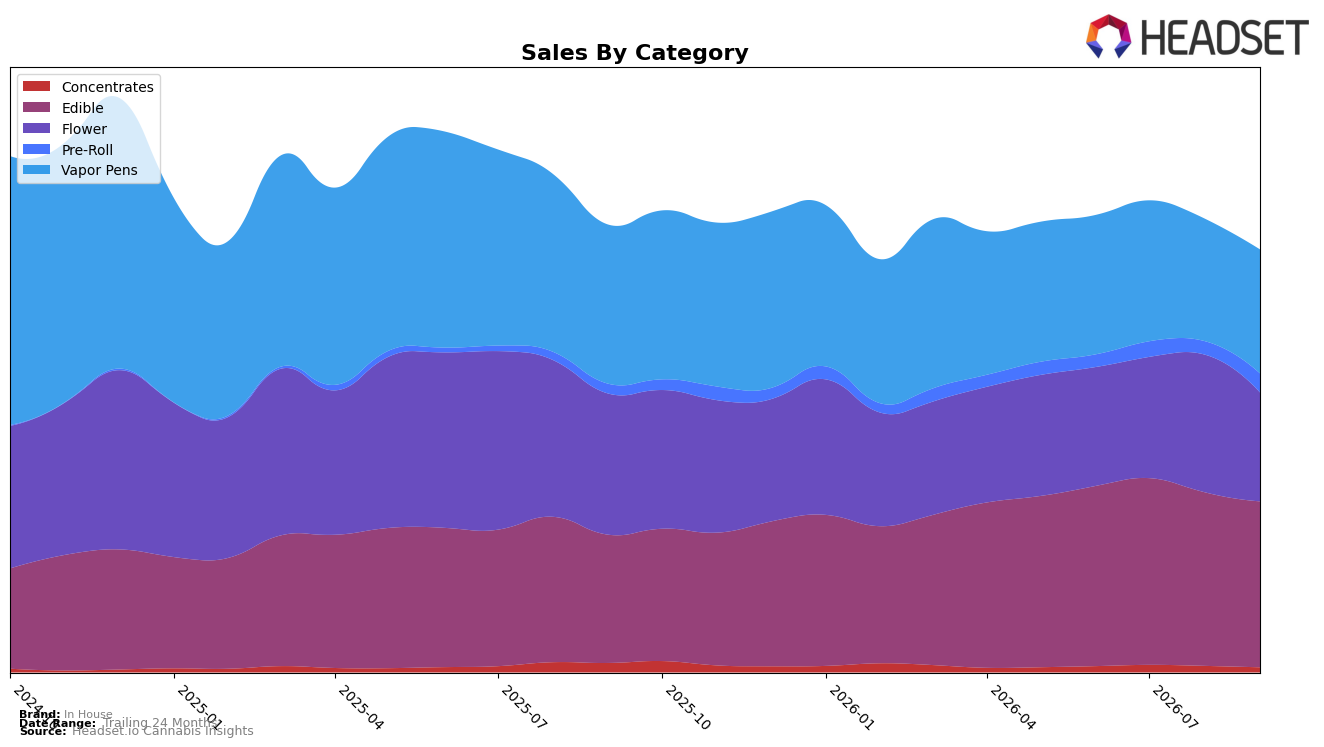
In September 2026, In House tilted further toward Edible, which held a 39.10% share and ranked 3 in Maryland Edible, while Vapor Pens and Flower trailed at 29.24% and 25.70% share, respectively. Year over year, Edible sales rose 29.23% as average price fell 14.03%, contrasting with Vapor Pens at -22.02% YoY and Flower at -22.76% YoY, and month over month Edible slipped -4.42% while Vapor Pens edged up 1.16% and Flower fell -20.80%. Pre-Roll, though just 4.61% share, expanded 89.17% YoY and 39.93% MoM, whereas Concentrates contracted -42.88% YoY and -19.76% MoM to 1.35% share. The pattern implies In House is consolidating around value-leaning format mixes where price elasticity is favorable, using Edible scale and Pre-Roll momentum to offset structural declines in Flower and Concentrates.
The mix shift suggests a repositioning toward accessible, non-inhalable and convenience-led formats: Edible commanding 39.10% share alongside a 29.23% YoY sales increase and Pre-Roll’s 39.93% MoM surge indicate demand capture where unit economics benefit from a 14.03% brand-wide price decline. With Vapor Pens stabilizing MoM at 1.16% amidst a -22.02% YoY drag and Flower dropping -20.80% MoM, the portfolio is de-risking from volatile inhalables toward categories with steadier rank potential, anchored by the rank 3 posture in Maryland Edible. This configuration implies near-term share defense will come from deepening Edible penetration and scaling Pre-Roll trial while selectively pruning low-yield Concentrates, using Vapor Pens as a hold line rather than a growth engine.
Competitive Landscape
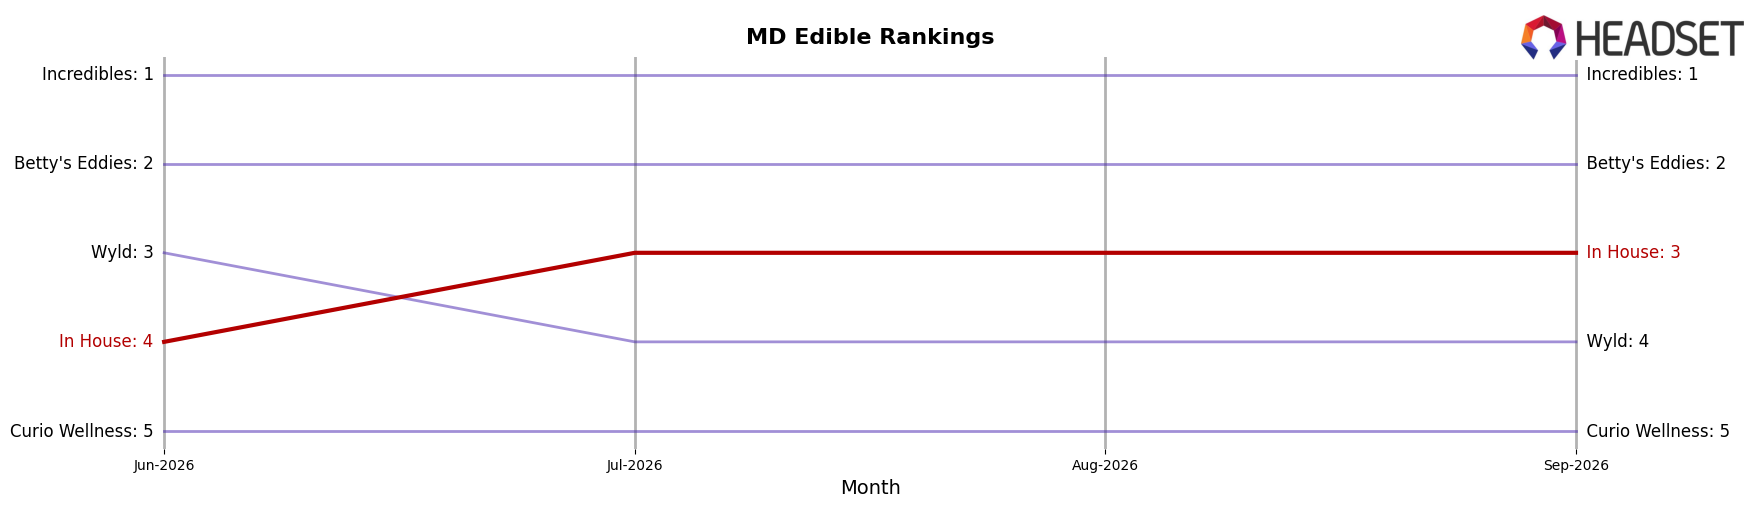
In House is ranked #3 in MD Edible for September 2026, improving 3 positions from #6 year over year and edging up 1 spot from #4 in June 2026, while reaching its peak rank of #3 in September 2026; meanwhile, Incredibles climbed from #5 to #1 with 58.10% YoY sales growth and Betty's Eddies held at #2 despite a -7.27% YoY decline, whereas Wyld slid from #1 to #4 with -32.89% YoY sales. With Curio Wellness dropping from #4 to #5 on -23.86% YoY sales, In House’s ascent into the top three amid mixed competitor momentum implies a consolidation phase where holding share against a rising #1 and weakening #2/#4 sets up a near-term test of whether rank gains convert to durable top-tier positioning.
Notable Products
Cherry Lemonade Fast Acting Gummies 10-Pack (100mg) posted the steepest decline in September 2026 at -18.4% while sliding to rank 4, as the category leader CBD/THC 5:1 Blood Orange Fast Acting Gummies 10-Pack (500mg CBD, 100mg THC) dipped -3.6% at rank 1. In contrast, Peach Mango Fast Acting Gummies 10-Pack (100mg) rose 9.7% to rank 2 as CBD/THC/CBN 3:2:1 Blueberry Dreams Nano Gummies 10-Pack (150mg CBD, 100mg THC, 50mg CBN) climbed 8.8% at rank 3, and six of the top ten are Fast Acting Gummies 10-Packs, concentrating velocity in the same pack format. The $208,857 posted by the Blood Orange 5:1 SKU alongside a -9.1% move for Watermelon Fast Acting Gummies 10-Pack (100mg) at rank 6 points to flavor-specific churn within a stable format hierarchy. The pattern implies In House is consolidating around Fast Acting 10-Packs with selective flavor repositioning needed to counter sharp drops in individual SKUs.
Top Selling Cannabis Brands






Data for this report comes from real-time sales reporting by participating cannabis retailers via their point-of-sale systems, which are linked up with Headset’s business intelligence software. Headset’s data is very reliable, as it comes digitally direct from our partner retailers. However, the potential does exist for misreporting in the instance of duplicates, incorrectly classified products, inaccurate entry of products into point-of-sale systems, or even simple human error at the point of purchase. Thus, there is a slight margin of error to consider. Brands listed on this page are ranked in the top twenty within the market and product category by total retail sales volume.

