Market Insights Snapshot
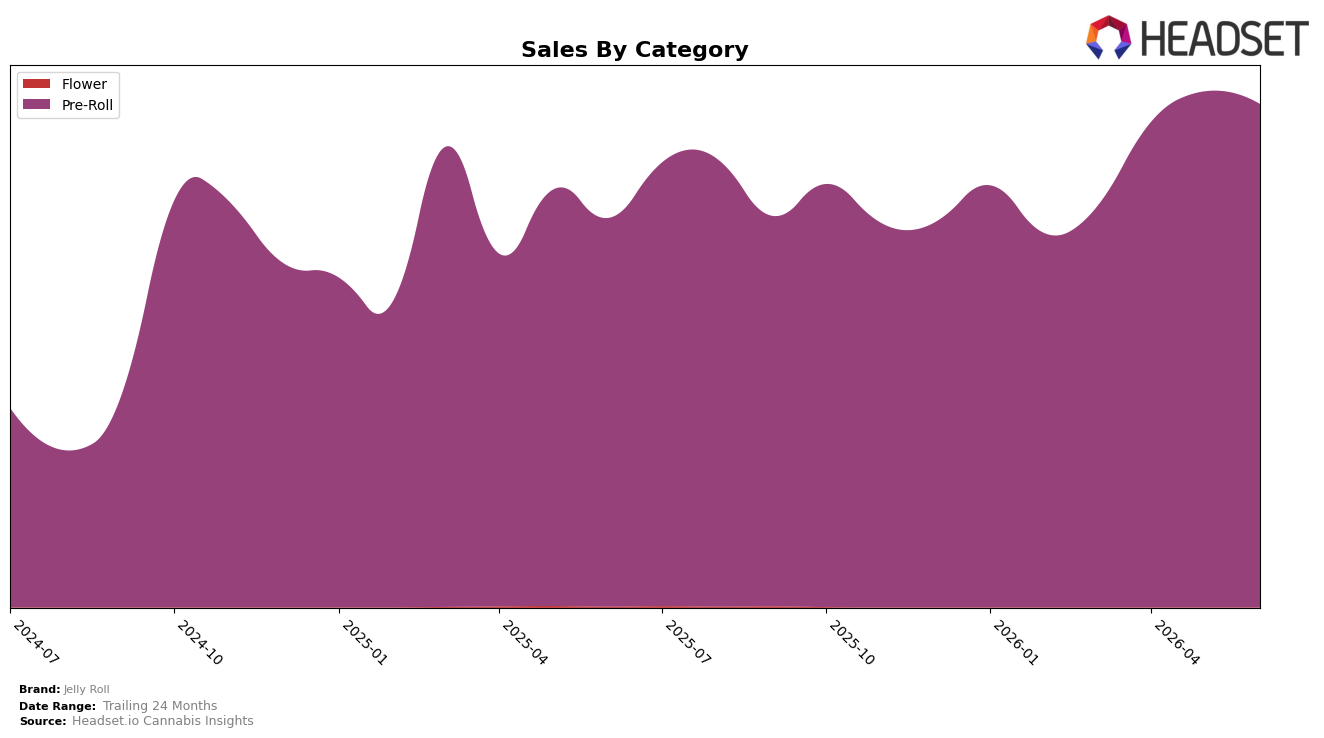
In June 2026, Jelly Roll concentrated entirely in Pre-Roll, with 100.0% category share, posting a year-over-year sales increase of 29.54% alongside a month-over-month decline of 2.45%. Average price moved down 1.55% year over year to $16.95 while sales for the brand rose 29.31%, indicating unit growth outpacing price compression; within Missouri Pre-Rolls, the brand held rank 7. The pattern implies a volume-led expansion within a single-category footprint, where June 2026 softening versus May 2026 coexists with a higher annual trajectory that supports sustained relevance inside rank 7.
The exclusive reliance on Pre-Roll at 100.0% share paired with a 29.31% brand sales YoY lift and a 1.55% YoY price decrease suggests Jelly Roll is leaning into value-accessible formats to gain units, even as June 2026 MoM sales slipped 2.45% while pricing held stable month over month. Holding rank 7 in Missouri despite the MoM dip, combined with a 164.74% two-year brand growth rate, points to a positioning anchored in repeatable volume over premium pricing, implying near-term defensibility comes from maintaining promotional efficiency and pack architecture rather than trading up.
Competitive Landscape
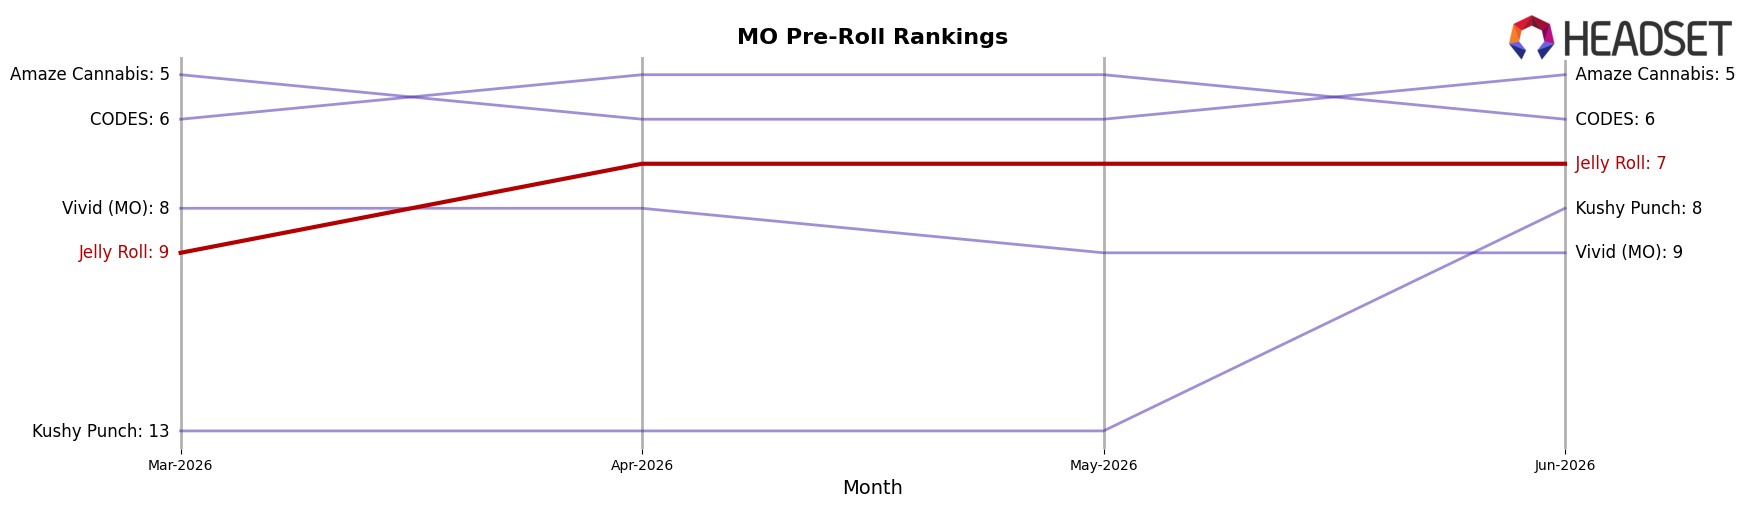
Jelly Roll sits at rank #7 in MO Pre-Roll in June 2026, slipping 1 position year over year from #6 and improving 2 spots since March 2026 from #9, while remaining 2 places below its peak of #5 from January 2025; in contrast, Jeeter holds #1 and Sinse Cannabis jumped from #7 to #3 year over year (+4 ranks), outpacing Jelly Roll’s -1 rank movement as Good Day Farm fell from #1 to #4 (-3 ranks) alongside a 39.54% sales decline. The combination of a 2-rank climb since March 2026 and a 1-rank YoY dip suggests Jelly Roll is stabilizing mid-tier but ceding momentum to faster risers, implying the current trajectory points to consolidation rather than a return to its #5 peak without a share-accretive shift.
Notable Products
Watermelon Infused Pre-Roll (1.1g) set the tone in June 2026 with a -34.1% month-over-month slide while holding rank 1, and Peaches N Cream Infused Pre-Roll (1.1g) also declined -13.5% at rank 3, signaling that single-stick leaders are ceding momentum even as Grape Infused Pre-Roll (1.1g) rose +10.7% at rank 2. Nine of the top ten are Pre-Roll SKUs, with two multi-pack formats in the top 10, and the Blue Razz Infused Pre-Roll 5-Pack (3g) at rank 5 concentrated $88,256 in sales while the Peaches N Cream Distillate Infused Pre-Roll 5-Pack (3g) at rank 9 slipped just -2.3%, implying multi-packs are stabilizing the lineup as single-stick volatility increases. The mix points to a shift toward value-density and repeat purchase behavior in larger formats, suggesting Jelly Roll should emphasize multi-pack depth while triaging flavor-level softness in flagship single sticks.
Top Selling Cannabis Brands
Data for this report comes from real-time sales reporting by participating cannabis retailers via their point-of-sale systems, which are linked up with Headset’s business intelligence software. Headset’s data is very reliable, as it comes digitally direct from our partner retailers. However, the potential does exist for misreporting in the instance of duplicates, incorrectly classified products, inaccurate entry of products into point-of-sale systems, or even simple human error at the point of purchase. Thus, there is a slight margin of error to consider. Brands listed on this page are ranked in the top twenty within the market and product category by total retail sales volume.

