Jun-2026
Sales
Trend
6-Month
Product Count
SKUs
Avg Price
YoY Sales Change
YoY Price Change
Market Insights Snapshot
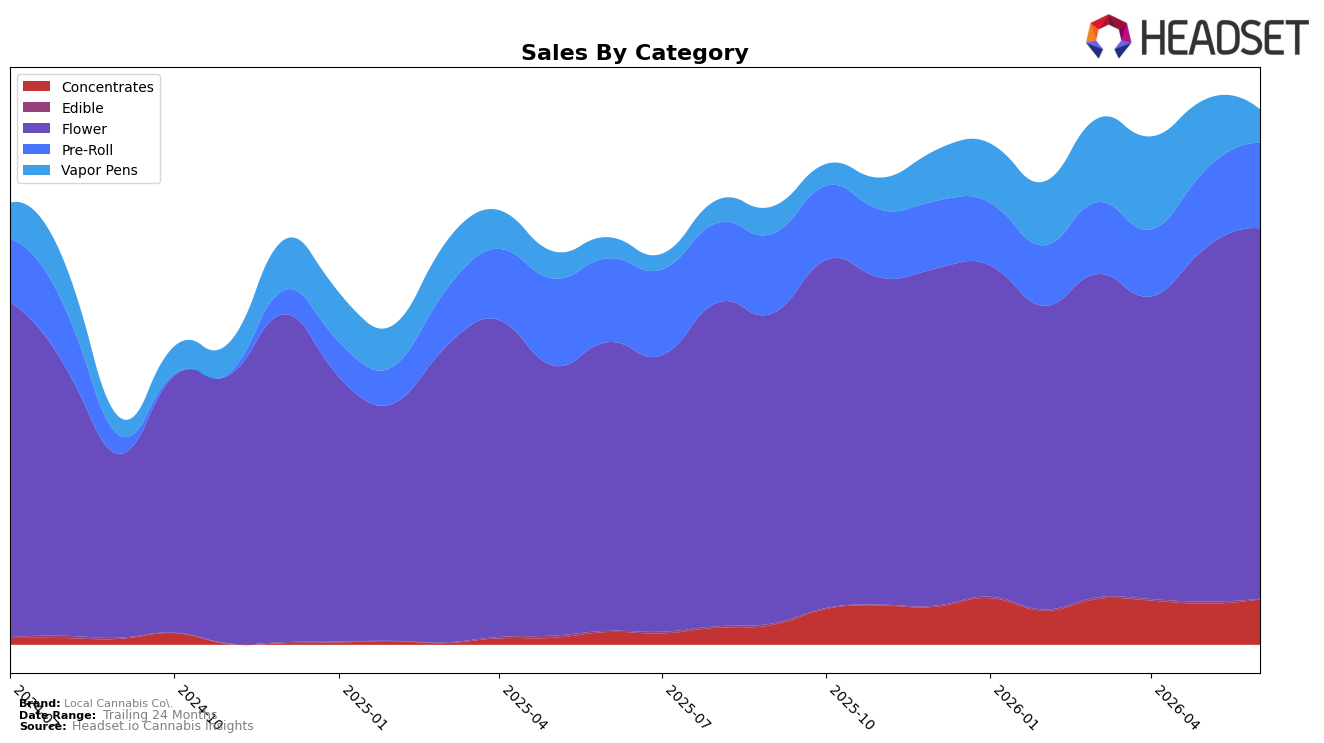
Local Cannabis Co. concentrated its mix in Flower at 68.95% share with 28.26% year-over-year growth and 4.93% month-over-month, while Pre-Roll held 15.96% share with 1.85% YoY and 9.58% MoM; meanwhile, Concentrates expanded to 8.54% share on 245.74% YoY and 10.36% MoM. Vapor Pens slipped to 6.34% share with 58.32% YoY but a -52.45% MoM drop, and Edible contracted to 0.21% share with -31.43% YoY and -53.79% MoM. With a Flower rank of 5 in Missouri and the category contributing over two-thirds of sales, the pattern implies the brand is consolidating around inhalables, using Concentrates as a fast-growing secondary pillar while de-emphasizing Edible and reacting to volatility in Vapor Pens.
The mix shift—stable Flower growth (28.26% YoY) paired with outsized Concentrates acceleration (245.74% YoY) and sharp Vapor Pens retrenchment (-52.45% MoM)—implies a pivot toward higher-engagement segments where pricing power can be maintained alongside a 10.73% YoY increase in average price. Given Pre-Roll’s 9.58% MoM lift and 15.96% share versus Edible’s -53.79% MoM and 0.21% share, the portfolio is tilting toward quick-turn inhalables to protect rank 5 in Missouri Flower and buffer short-term volatility from Vapor Pens with Concentrates-led growth.
Competitive Landscape
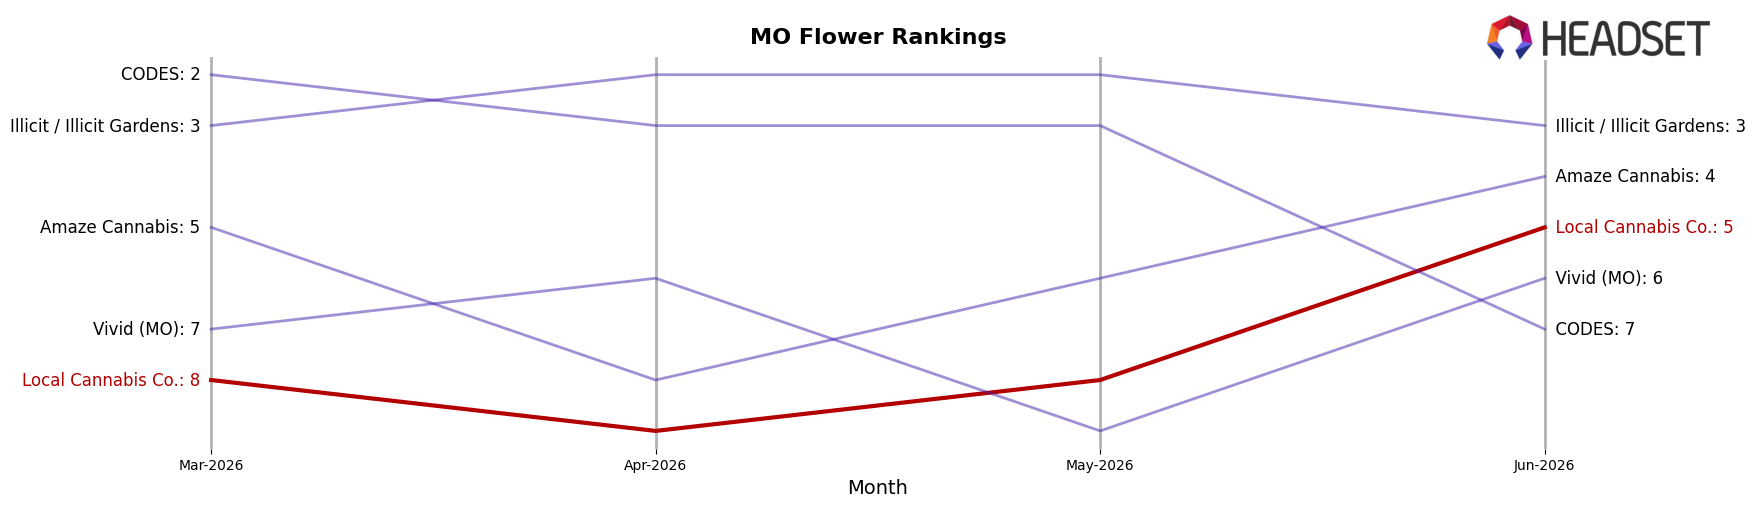
Local Cannabis Co. sits at rank #5 in MO Flower in June 2026, improving 5 positions year over year from #10, and rising 3 spots since March 2026 when it was #8; by contrast, Flora Farms held steady at #1 year over year while posting a -5.1% sales change, and Amaze Cannabis edged ahead at #4 after moving up from #6 with a 43.8% sales increase, indicating that Local Cannabis Co.’s first-time peak at #5 in June 2026 is the start of a catch-up phase where continued incremental rank gains are necessary to close the one-position gap to faster-accelerating competitors.
Notable Products
Orange 43 (3.5g) delivered the headline move in June 2026 with a +101.8% month-over-month surge to the number 1 rank, while Hash Burger (3.5g) fell -33.3% to rank 5. Lemon Slushee (3.5g) gained +28.5% at rank 3 as WiFi #3 (3.5g) inched up +6.0% at rank 8, and four of the top ten are Flower SKUs to anchor mix at the high end. The concentration of Flower alongside two Pre-Roll entries in the top 6, including Double Solo Burger Pre-Roll (0.5g) up +69.1% at rank 4, implies a pivot toward volume-driving inhalables with one flagship Flower SKU absorbing share from underperforming strains.
Top Selling Cannabis Brands
Data for this report comes from real-time sales reporting by participating cannabis retailers via their point-of-sale systems, which are linked up with Headset’s business intelligence software. Headset’s data is very reliable, as it comes digitally direct from our partner retailers. However, the potential does exist for misreporting in the instance of duplicates, incorrectly classified products, inaccurate entry of products into point-of-sale systems, or even simple human error at the point of purchase. Thus, there is a slight margin of error to consider. Brands listed on this page are ranked in the top twenty within the market and product category by total retail sales volume.

