.svg)

Sep-2026
Sales
Trend
6-Month
Product Count
SKUs
Avg Price
YoY Sales Change
YoY Price Change


Where to Buy
Proper Cannabis is stocked at 179 licensed dispensaries across Missouri, Michigan, and Washington, 171 of them in Missouri, with the deepest coverage in Kansas City, St. Louis, Springfield, Columbia, and Joplin. Search by ZIP code or city below to find the closest one, or filter by product type if you are after a specific format.
Market Insights Snapshot
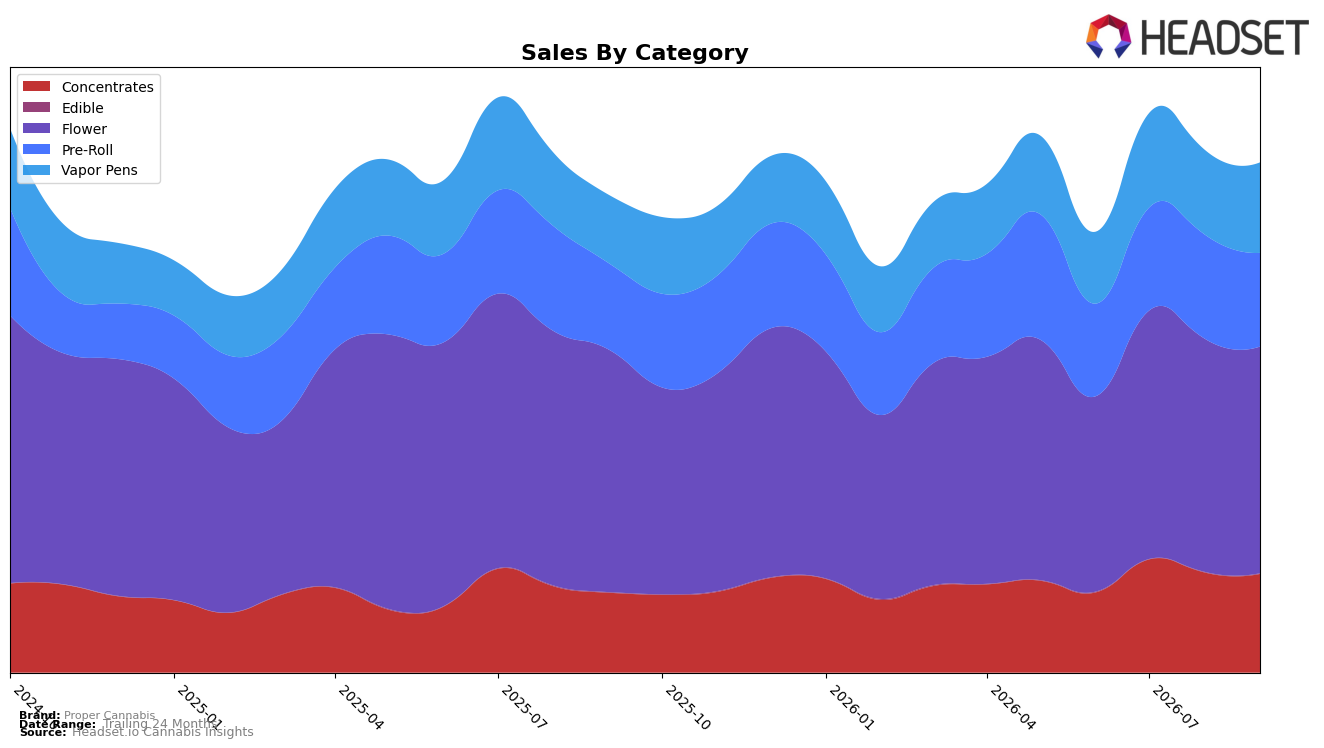
In September 2026, Proper Cannabis leaned on a three-tier mix anchored by Flower at 44.49% share, followed by Concentrates at 19.34% and Pre-Roll at 18.35%, while Vapor Pens held 17.73% and Edible was negligible at 0.08%. The mix masked divergent momentum: Flower contracted year over year by 6.61% and month over month by 2.78%, whereas Vapor Pens expanded 32.62% YoY and 6.80% MoM, and Concentrates rose 23.57% YoY despite a 1.49% MoM dip. Pre-Roll grew 8.31% YoY but dropped 10.14% MoM, and Edible, though only 0.08% of sales, jumped 23.16% MoM alongside a 6.42% YoY lift. With brand sales up 6.74% YoY amid a 17.97% YoY decline in average price, the pattern implies unit-led growth concentrated in higher-velocity inhalables while Flower’s scale-driven share is eroding at the margin.
The category shifts suggest Proper Cannabis is tilting toward faster-turn SKUs where price elasticity is stimulating demand: Vapor Pens’ 32.62% YoY gain against a 6.80% MoM uptick, combined with Concentrates’ 23.57% YoY growth, points to mix migration that offsets Flower’s 6.61% YoY decline. Given a Flower rank of 12 in Missouri and a 2.78% MoM contraction in that anchor category, maintaining overall growth likely hinges on sustaining the 10.14% MoM pullback reversal in Pre-Roll and preserving the 6.80% MoM momentum in Vapor Pens. The implication is a positioning pivot toward inhalable variety and value where price compression can win share, while Flower requires targeted assortment or promotional recalibration to prevent further share drift from its 44.49% base.
Competitive Landscape
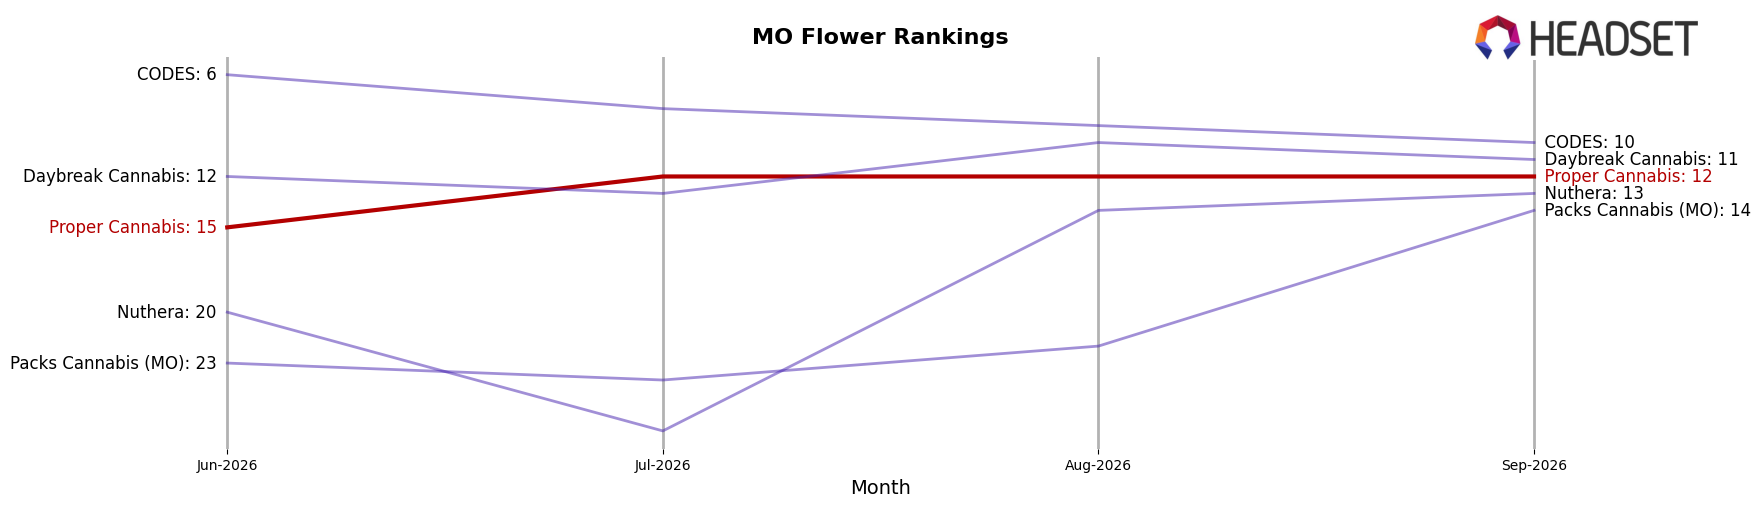
Proper Cannabis sits at rank #12 in Missouri Flower for September 2026, improving 1 position YoY from #13 and rising 3 positions from #15 in June 2026, while remaining 1 spot below its peak of #11 reached in March 2026; meanwhile, Flora Farms held at #1 YoY with a 33.4% sales increase and Amaze Cannabis climbed from #6 to #2 alongside a 19.8% sales gain, outpacing Proper Cannabis’s rank momentum, and Sinse Cannabis stayed flat at #3 while its sales fell 11.1%; this mix of slight rank improvement (+1 YoY) and near-peak positioning (within 1 rank of March 2026) implies Proper Cannabis is stabilizing mid-tier but must accelerate share capture to avoid being boxed out by faster climbers at the top.
Notable Products
The steepest decline came from Piescream 27 Pre-Roll (0.5g), which fell 34.9% month over month yet still held rank 1, while Memory Loss Pre-Roll (0.5g) dropped 37.2% to rank 3; this mix of contraction paired with top-tier ranks signals demand concentration amid volatility. Pre-Roll SKUs occupy seven of the top ten positions, and Black Maple 22 Pre-Roll (0.5g) sits at rank 2 with no reported month-over-month figure, indicating reliance on format breadth more than single-SKU momentum. In contrast, Flower holds ranks 3 and 4 through Paris Rock Candy (Bulk) and Butterwolf (3.5g), with the latter contributing a single-month $44,445 that helps offset Pre-Roll softness. The pattern implies Proper Cannabis is leaning on a Pre-Roll-heavy lineup for traffic while Flower provides margin ballast, suggesting a need to rebalance assortment toward fewer but steadier hero SKUs.
Top Selling Cannabis Brands






Data for this report comes from real-time sales reporting by participating cannabis retailers via their point-of-sale systems, which are linked up with Headset’s business intelligence software. Headset’s data is very reliable, as it comes digitally direct from our partner retailers. However, the potential does exist for misreporting in the instance of duplicates, incorrectly classified products, inaccurate entry of products into point-of-sale systems, or even simple human error at the point of purchase. Thus, there is a slight margin of error to consider. Brands listed on this page are ranked in the top twenty within the market and product category by total retail sales volume.

