.svg)
Sep-2026
Sales
Trend
6-Month
Product Count
SKUs
Avg Price
YoY Sales Change
YoY Price Change


Market Insights Snapshot
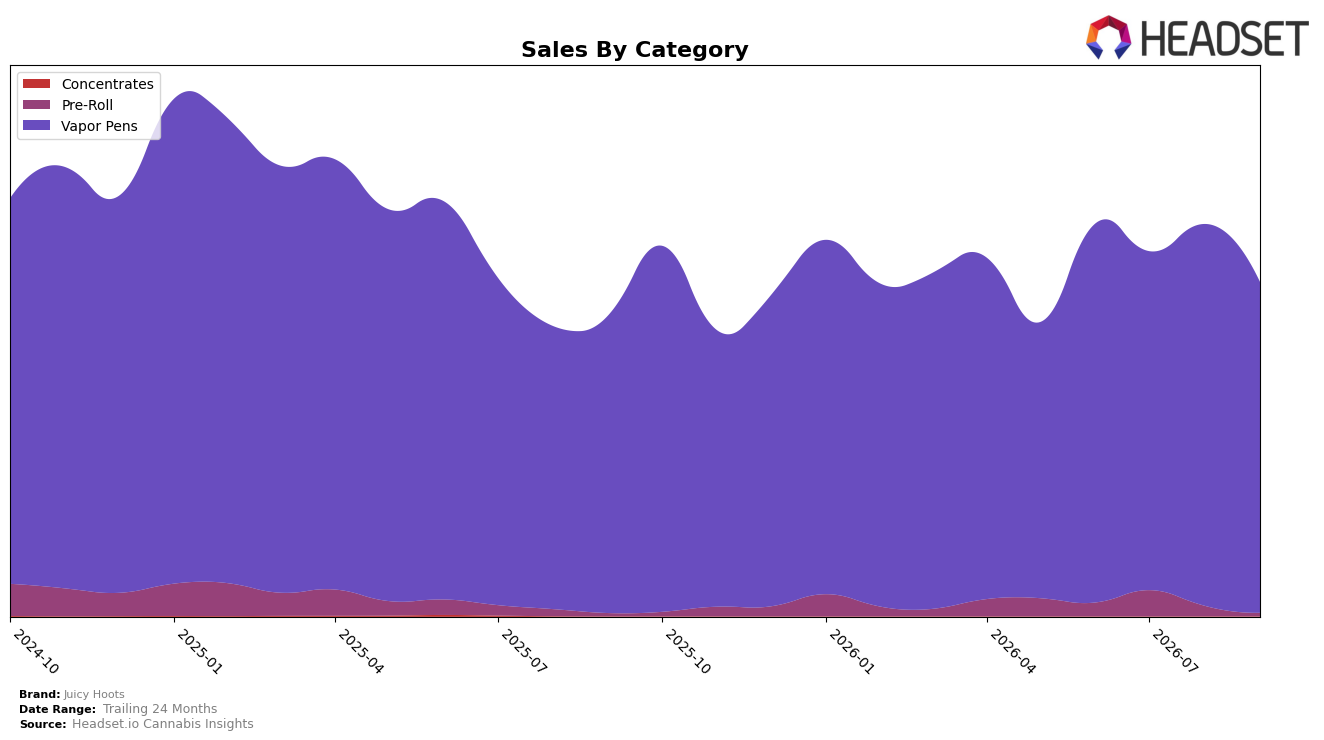
Juicy Hoots concentrated 99.07% of September 2026 sales in Vapor Pens, where year-over-year growth was 11.15% but month-over-month fell 13.35%, while the small Pre-Roll slice at 0.93% grew 8.98% YoY yet dropped 69.31% MoM. The brand’s overall sales were up 11.13% YoY with a 4.32% YoY price decrease alongside an average price of $32.86, and rank in Vapor Pens sat at position 11 in Saskatchewan; taken together, the mix indicates acute dependence on Vapor Pens with short-term volatility from August 2026 to September 2026 offset by full-year gains.
The steep 13.35% MoM decline in Vapor Pens against an 11.15% YoY increase, coupled with a 69.31% MoM pullback in Pre-Roll despite 8.98% YoY growth, implies the brand is trading on entrenched core demand while near-term velocity softened into September 2026. With Vapor Pens holding 99.07% share and the brand at rank 11 in Saskatchewan, the positioning relies on scale within one category and price-led defense (average prices down 4.32% YoY), implying headroom to stabilize monthly swings by leaning into the primary segment while using the marginal Pre-Roll presence as a testbed rather than a growth pillar.
Competitive Landscape
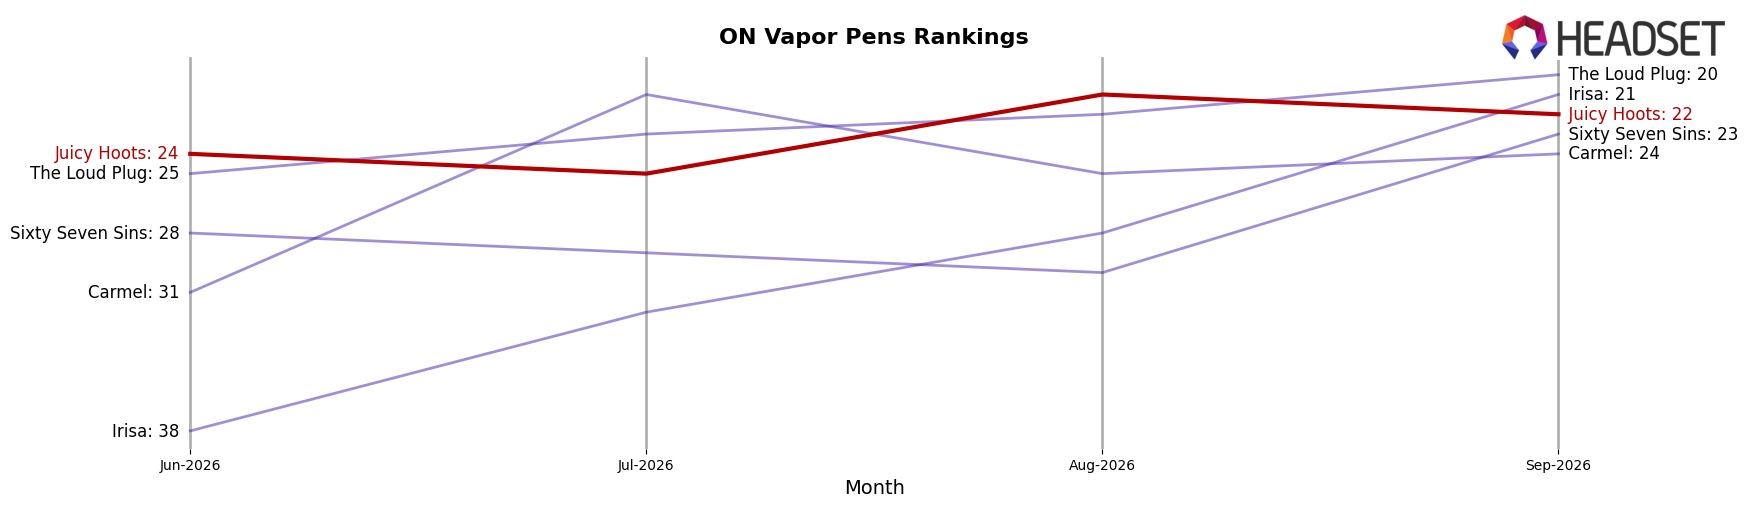
Juicy Hoots ranks #22 in ON Vapor Pens in September 2026, up 3 positions year over year from #25 and 2 spots since June 2026 from #24, but still 6 places below its peak of #16 reached in November 2024; meanwhile, Spinach climbed from #4 to #1 with 172.5% YoY sales growth and Kolab jumped from #14 to #5 with 93.0% YoY growth, while General Admission slid from #3 to #4 alongside an 12.0% YoY sales decline. The contrast between Juicy Hoots’ modest rank gain of 3 places and competitors’ double-digit rank moves indicates incremental recovery rather than breakout momentum, implying that maintaining a #22 position against rapid movers raises execution risk for regaining a top-20 slot.
Notable Products
Blue Cherry Diamond Drizzle Disposable (1g) posted the steepest move in September 2026 with a -63.2% MoM drop to $12,607 while sliding to rank 9, and Berry Punch Diamonds Drizzle Cartridge (1g) fell -60.3% at rank 6, indicating the Diamond/Drizzle line is losing velocity versus earlier months. In contrast, Double Grape Giggles Distillate Cartridge (1g) surged +62.3% MoM to rank 5 as Double Blue Cherry Distillate Disosable (1g) held rank 1 on a +2.5% MoM uptick, suggesting Distillate formats are capturing share from premium spin-offs. With all ten top SKUs in Vapor Pens and four in the top five carrying Distillate labeling, the assortment is consolidating around straightforward Distillate value cues rather than novelty sub-lines. The product mix implies Juicy Hoots is tilting toward high-velocity Distillate cartridges and disposables while deprioritizing Diamond/Drizzle experiments that are failing to sustain rank.
Top Selling Cannabis Brands






Data for this report comes from real-time sales reporting by participating cannabis retailers via their point-of-sale systems, which are linked up with Headset’s business intelligence software. Headset’s data is very reliable, as it comes digitally direct from our partner retailers. However, the potential does exist for misreporting in the instance of duplicates, incorrectly classified products, inaccurate entry of products into point-of-sale systems, or even simple human error at the point of purchase. Thus, there is a slight margin of error to consider. Brands listed on this page are ranked in the top twenty within the market and product category by total retail sales volume.

