May-2026
Sales
Trend
6-Month
Product Count
SKUs
Avg Price
YoY Sales Change
YoY Price Change
Market Insights Snapshot
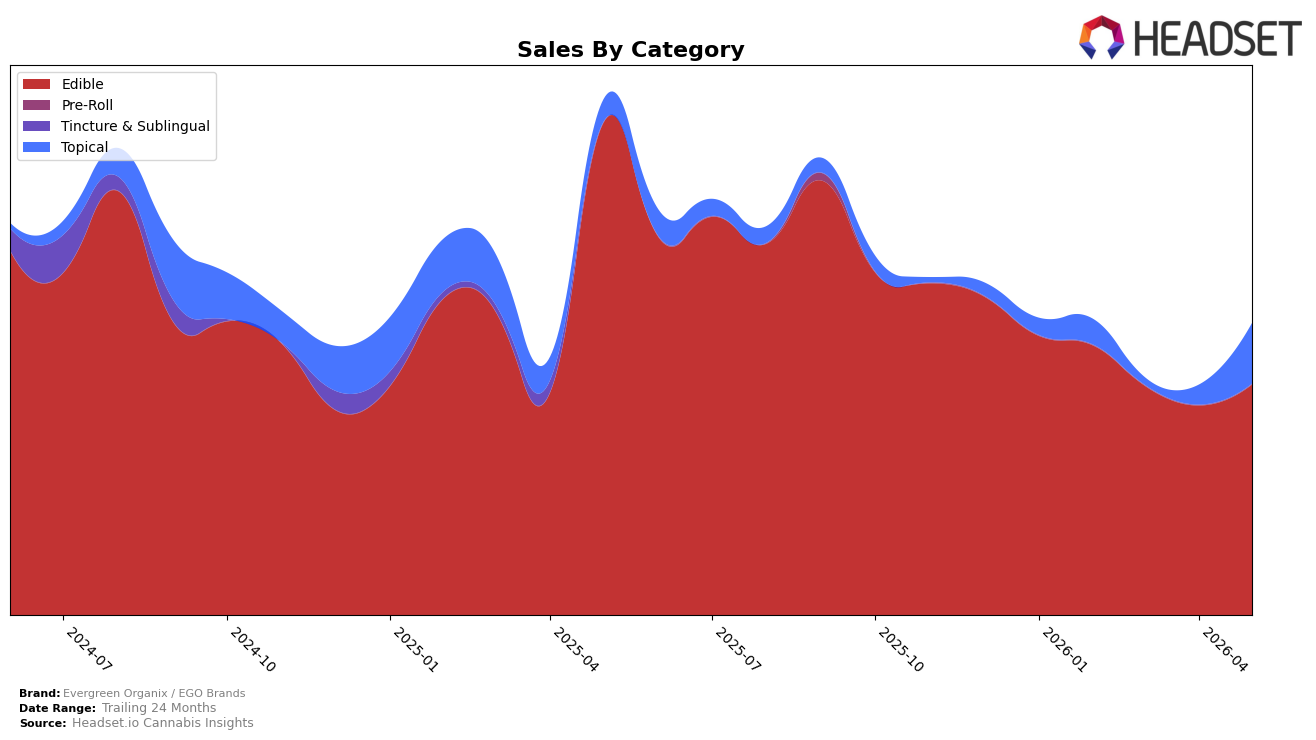
Evergreen Organix / EGO Brands concentrated 79.25% of May 2026 sales in Edible while Topical expanded to 20.75% share, up from a much smaller base, with Edible down 53.22% year over year and up 9.99% month over month, and Topical up 172.23% year over year and up 209.62% month over month. Despite the 15.09% year-over-year rise in average price to $21.16, Edible’s contraction alongside a surge in higher-priced Topical at an average of 33.64 implies the brand is rebalancing toward fewer, higher-ticket units even as overall brand sales fell 43.52% year over year.
Positionally, the brand sits at rank 22 in Edible in Nevada, a tier suggesting mid-pack visibility, while Topical’s rapid share gain and triple-digit month-over-month growth indicate a pivot where incremental distribution or SKU focus could shift competitive emphasis away from price-sensitive Edible into a premium-leaning niche. Given Edible’s 9.99% month-over-month lift but deep 53.22% year-over-year decline, and Topical’s 172.23% year-over-year surge, the pattern implies short-term momentum is being driven by Topical’s expansion, positioning Evergreen Organix / EGO Brands to trade rank upside in categories where price elasticity is lower and average selling price headroom exists.
Competitive Landscape
Evergreen Organix / EGO Brands sits at rank #22 in NV Edible for May 2026, down 5 positions year over year from #17, and essentially flat versus February 2026 where it held #23; by contrast, Wyld held #1 both this year and last while its sales fell 15.2% year over year, and Kanha / Sunderstorm climbed from #10 to #4 on 205.8% YoY sales growth, indicating competitors are gaining share even as the category’s leader contracts. With a prior peak at #17 in May 2025 and a May 2026 position of #22, the three-month movement from #23 to #22 suggests stabilization rather than recovery, implying the brand’s rank trajectory points to entrenchment in the low-20s unless it captures growth akin to Good Tide moving from #7 to #5 alongside a 39.6% YoY sales increase.

Notable Products
Snickerdoodle Cookie 5-Pack (100mg) led May 2026 with a +125.9% month-over-month surge to rank 1, while Dubai Chocolate Bar 10-Pack (100mg) fell -22.0% to rank 2, indicating share shift within the Edible lineup. Milk Chocolate Crunch Bar (100mg) climbed +42.7% at rank 3 as Marshmallow Cereal Treat (100mg) added +12.4% at rank 4, and six of the top ten SKUs were Edibles, concentrating demand in confection formats. Intimate Massage Oil (75mg) posted a +130.8% jump at rank 7 as Intimate Massage Body Oil (100mg THC, 1oz) held rank 10 with $4,596 in May 2026 sales, signaling growing traction for Topicals alongside cookie-led gains. The mix implies Evergreen Organix / EGO Brands is pivoting toward high-velocity cookies while selectively expanding Topicals to diversify beyond chocolate bars.
Top Selling Cannabis Brands
Data for this report comes from real-time sales reporting by participating cannabis retailers via their point-of-sale systems, which are linked up with Headset’s business intelligence software. Headset’s data is very reliable, as it comes digitally direct from our partner retailers. However, the potential does exist for misreporting in the instance of duplicates, incorrectly classified products, inaccurate entry of products into point-of-sale systems, or even simple human error at the point of purchase. Thus, there is a slight margin of error to consider. Brands listed on this page are ranked in the top twenty within the market and product category by total retail sales volume.

