Market Insights Snapshot
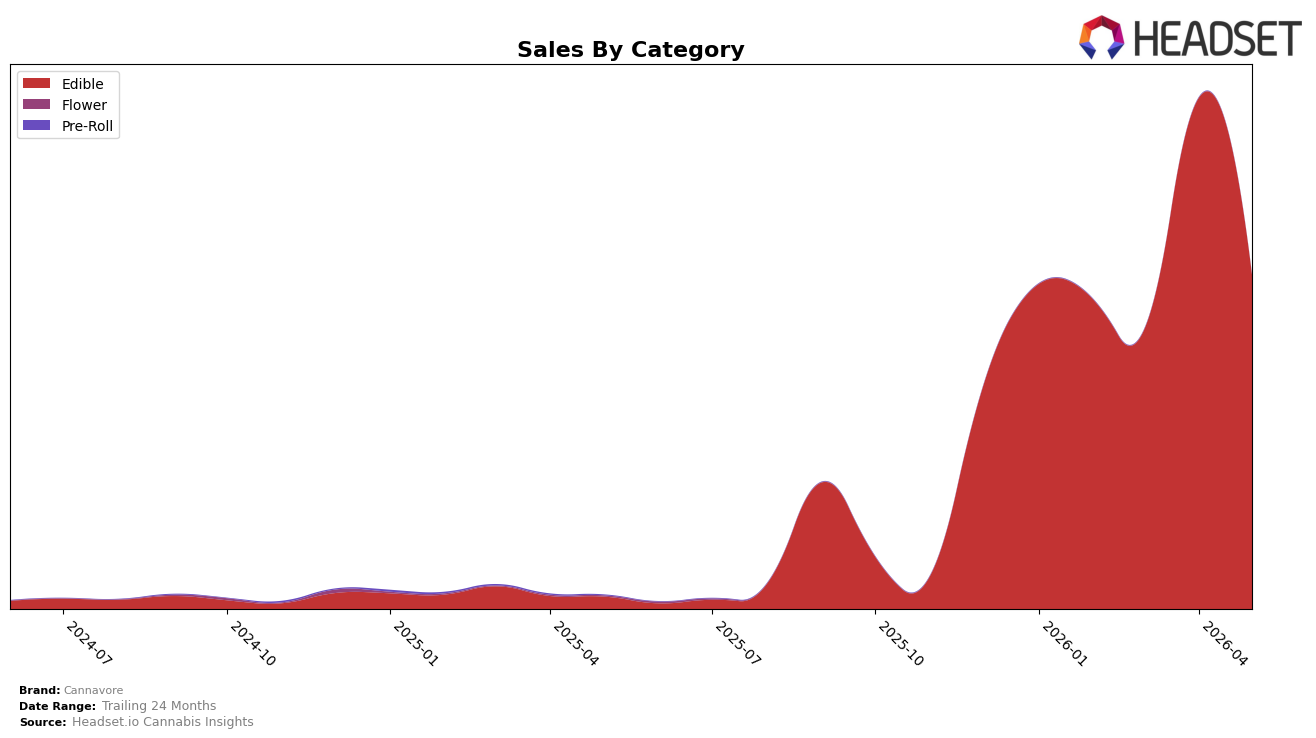
In May 2026, Cannavore operated as a single-category brand with Edible at 100.0% category share, sitting at rank 8 in Nevada Edible while posting a 2706.98% year-over-year sales increase and a -34.64% month-over-month decline. Average price fell -16.74% year over year to $17.67 alongside brand-level sales growth of 2436.15% year over year, indicating volume expansion offset by price compression; the 24-month sales lift of 3865.26% paired with a May 2026 rank of 8 implies the brand scaled quickly but ceded near-term momentum month over month.
The combination of a -34.64% month-over-month dip with a 2706.98% year-over-year gain suggests Cannavore’s demand is concentrated in Edible and exposed to intra-quarter volatility, with rank 8 in Nevada signaling mid-tier placement despite outsized annual growth. With 100.0% of sales in Edible and a -16.74% price shift year over year, the brand’s position is anchored in value-accessible SKUs that trade price for share, implying that sustaining rank improvement will depend on stabilizing monthly cadence within Edible rather than diversification in the near term.
Competitive Landscape
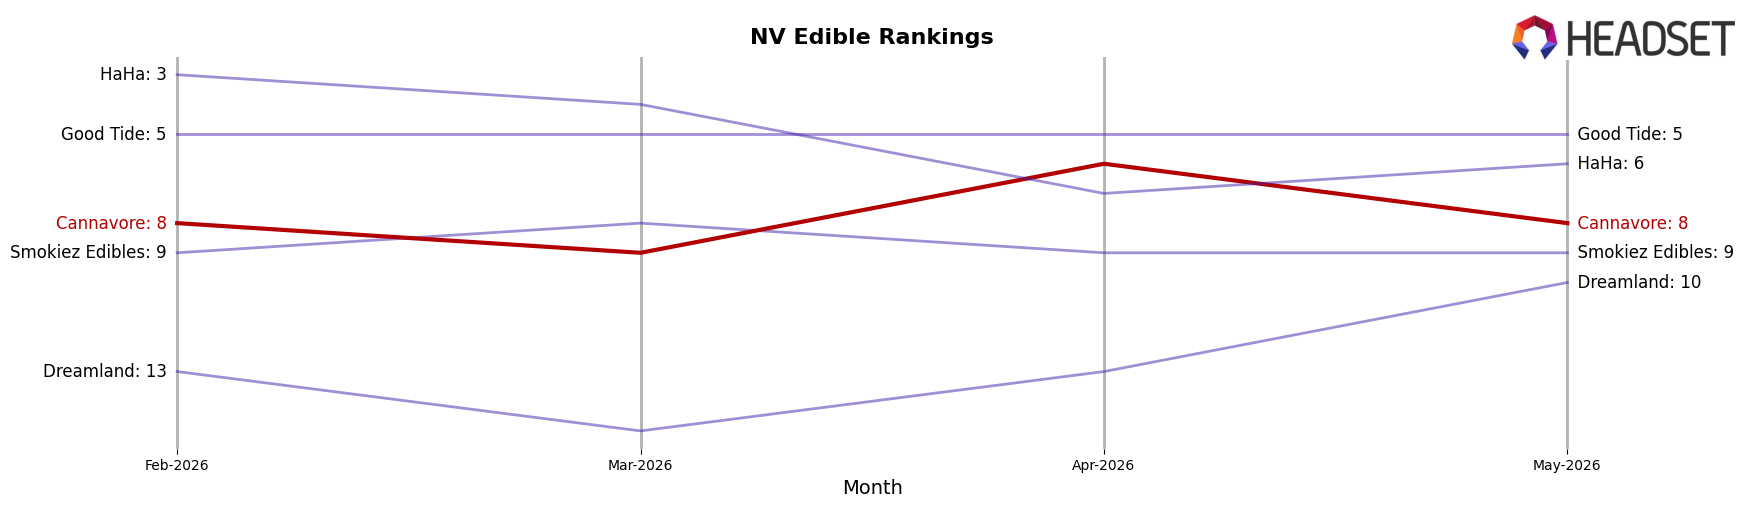
Cannavore is currently ranked #8 in NV Edible, improving 30 positions from #38 year over year, and it matched its February-to-May stability by holding #8 over the past three months while peaking at #6 in April 2026; meanwhile, Wyld held #1 with a -15.2% YoY sales decline and Kanha / Sunderstorm advanced from #10 to #4 with +205.8% YoY sales growth, indicating Cannavore’s rank gains are outpacing flat-to-declining leaders but lagging the surge of fast risers, which implies a trajectory toward the lower end of the top 10 unless velocity accelerates beyond April 2026’s peak.
Notable Products
CBN/THC 1:2 Passionfruit Guava Gummies 10-Pack (50mg CBN, 100mg THC) posted the largest month-over-month surge at +465.2%, jumping into rank 8 while Irish Cream Caramels Chews 10-Pack (100mg) fell -80.3% to rank 10. At the top, CBD/THC 3:1 Cherry Pineapple Gummies 10-Pack (300mg CBD, 100mg THC) retained rank 1 despite a -43.2% decline, and the CBD/THC 2:1 Passion Fruit Guava Gummies 10-Pack (200mg CBD, 100mg THC) slid -43.7% at rank 5. Eight of the top ten SKUs are ratioed minor-cannabinoid Edibles, indicating a portfolio tilted toward functional formulations rather than classic confections, which implies Cannavore is prioritizing effect-specific gummies even as volatility reshuffles ranks.
Top Selling Cannabis Brands
Data for this report comes from real-time sales reporting by participating cannabis retailers via their point-of-sale systems, which are linked up with Headset’s business intelligence software. Headset’s data is very reliable, as it comes digitally direct from our partner retailers. However, the potential does exist for misreporting in the instance of duplicates, incorrectly classified products, inaccurate entry of products into point-of-sale systems, or even simple human error at the point of purchase. Thus, there is a slight margin of error to consider. Brands listed on this page are ranked in the top twenty within the market and product category by total retail sales volume.

