Jun-2026
Sales
Trend
6-Month
Product Count
SKUs
Avg Price
YoY Sales Change
YoY Price Change
Market Insights Snapshot
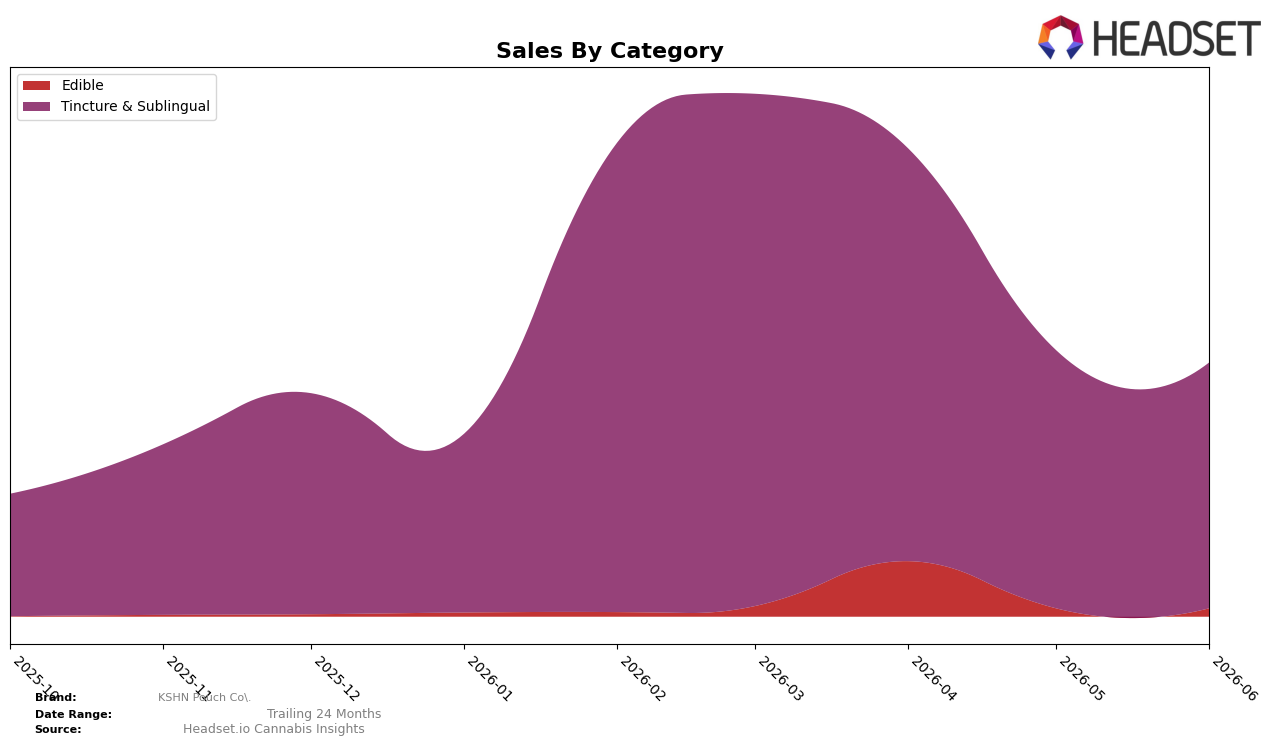
KSHN Pouch Co. concentrated 96.85% of June 2026 sales in Tincture & Sublingual while Edible accounted for 3.15%, indicating a narrow category footprint alongside a modest secondary bet. Month over month, Tincture & Sublingual declined 4.69% as Edible grew 1.78%, a simultaneous contraction-and-expansion that leaves the average ticket at $13.13 and suggests incremental diversification without material mix dilution. The brand held rank 5 in Tincture & Sublingual in Michigan, and the combination of a top-five position with a 96.85% reliance implies that even small share shifts in the core category can outsizedly influence total performance.
The 4.69% month-over-month dip in Tincture & Sublingual against a 1.78% gain in Edible implies sensitivity to demand movements in the primary format while testing a secondary format that currently lacks scale leverage. With rank 5 in Michigan Tincture & Sublingual and a 96.85% mix weight, the brand’s positioning skews toward defending core share rather than pursuing rapid mix expansion; at present scale, the 3.15% Edible slice cannot offset core volatility. The pattern implies that near-term stability depends on reversing the core’s 4.69% MoM decline or increasing the Edible share by multiple points, as the current balance keeps overall outcomes tethered to Tincture & Sublingual rank dynamics.
Competitive Landscape
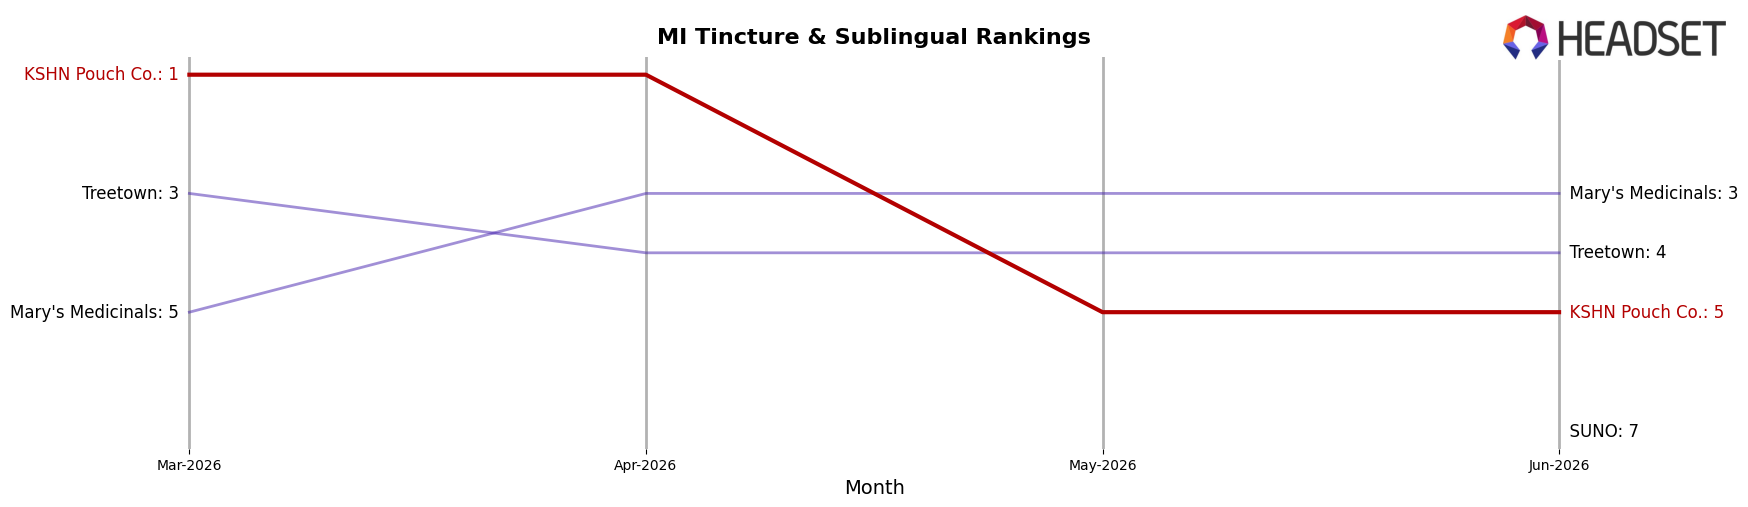
KSHN Pouch Co. sits at rank #5 in Michigan Tincture & Sublingual for June 2026, down four positions from rank #1 in March 2026 and off its peak at rank #1 in April 2026; by contrast, Vlasic Labs holds rank #1 while moving three places year over year, and Treetown is ahead at rank #4 despite a 33.3% year-over-year sales decline compared to KSHN Pouch Co.’s three-month slide from #1 to #5. Meanwhile, Rise (MI) sits at rank #2 with a 55.5% year-over-year sales contraction and Mary's Medicinals is rank #3 with a 14.2% year-over-year sales increase, indicating KSHN Pouch Co.’s relative position loss is driven more by short-term share rotation than broad category contraction; the pattern implies the brand’s rank trajectory from #1 in April 2026 to #5 in June 2026 is a near-term retracement that can be reversed if execution matches top-three stability rather than year-over-year momentum alone.
Notable Products
Cinnamon Pouch 20-Pack (200mg) posted the largest movement in June 2026 with +119% MoM, jumping into rank 4, while Spearmint Pouch 20-Pack (200mg) fell -14% to rank 3. Tropical Pouch 20-Pack (200mg) split directions across formats, sliding -27% at rank 2 in Tincture & Sublingual even as its Edible variant rose +35% to rank 5. Five of the top six SKUs are pouches across two formats, and the Sweet Mint Gummy (100mg) plunged -70% to rank 6 on $170, indicating flavor equity is anchored to pouch delivery rather than gummies. The pattern implies KSHN Pouch Co. is consolidating share around pouch formats and should prioritize format-led extensions over standalone gummy plays.
Top Selling Cannabis Brands
Data for this report comes from real-time sales reporting by participating cannabis retailers via their point-of-sale systems, which are linked up with Headset’s business intelligence software. Headset’s data is very reliable, as it comes digitally direct from our partner retailers. However, the potential does exist for misreporting in the instance of duplicates, incorrectly classified products, inaccurate entry of products into point-of-sale systems, or even simple human error at the point of purchase. Thus, there is a slight margin of error to consider. Brands listed on this page are ranked in the top twenty within the market and product category by total retail sales volume.

