Jun-2026
Sales
Trend
6-Month
Product Count
SKUs
Avg Price
YoY Sales Change
YoY Price Change
Market Insights Snapshot
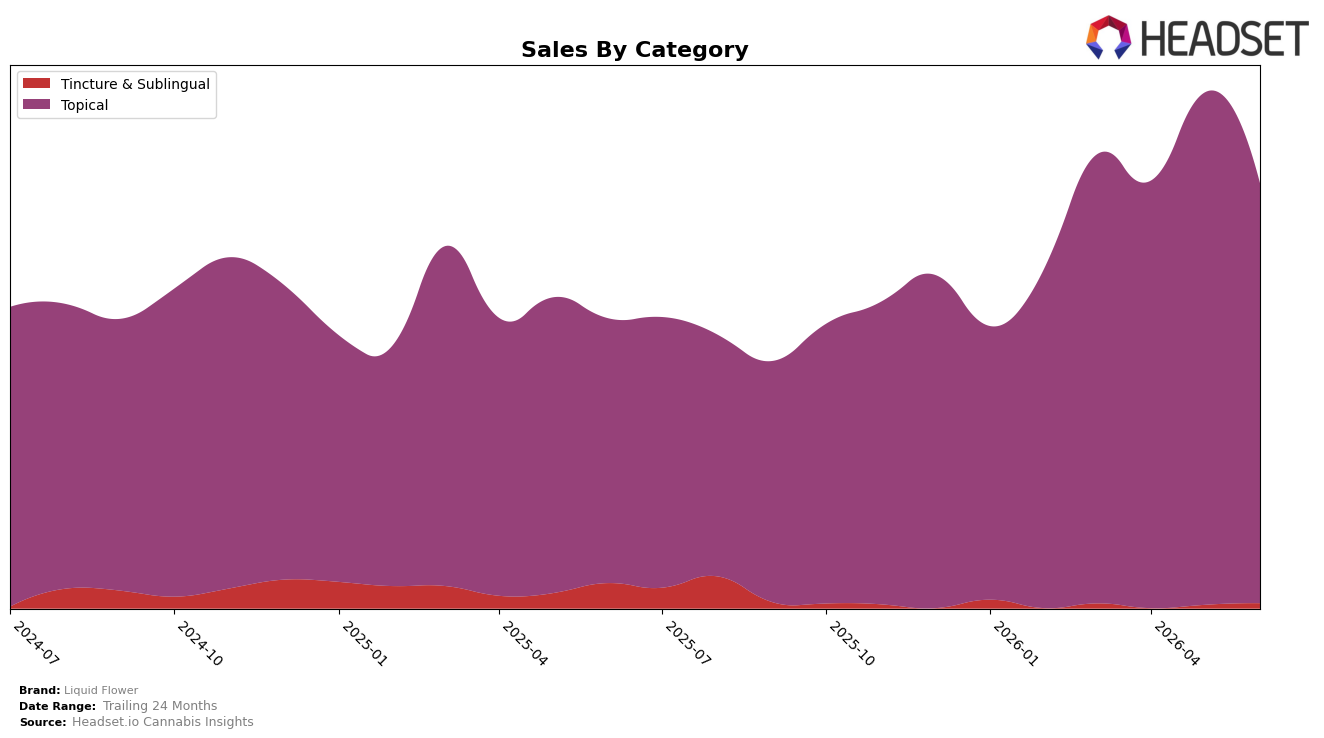
In June 2026, Liquid Flower’s category mix was overwhelmingly concentrated in Topical, holding 98.82% share with a year-over-year increase of 58.72% and a month-over-month decline of 18.03%, while Tincture & Sublingual represented 1.18% share with a year-over-year decrease of 80.03% but a month-over-month rebound of 49.67%. The average price rose 5.54% year over year to $34.62, with Topical averaging $34.54 and Tincture & Sublingual at $42.08, implying price-led value capture alongside volume contraction month over month; this pattern implies the brand is consolidating around a single category leader while allowing a small, volatile niche to act as an option on incremental growth.
These shifts position Liquid Flower as a Topical specialist anchored in California, where it sits at rank 4 in Topical, signaling depth in a category where the brand’s 98.82% mix and 58.72% year-over-year Topical growth contrast with the 18.03% month-over-month pullback. The 49.67% month-over-month uptick in Tincture & Sublingual alongside an 80.03% year-over-year decline indicates episodic demand that can augment reach without diluting the Topical core; overall, this composition implies the brand’s positioning benefits from defending rank 4 through sustained Topical scale while using a small-format tail to probe adjacent need states.
Competitive Landscape
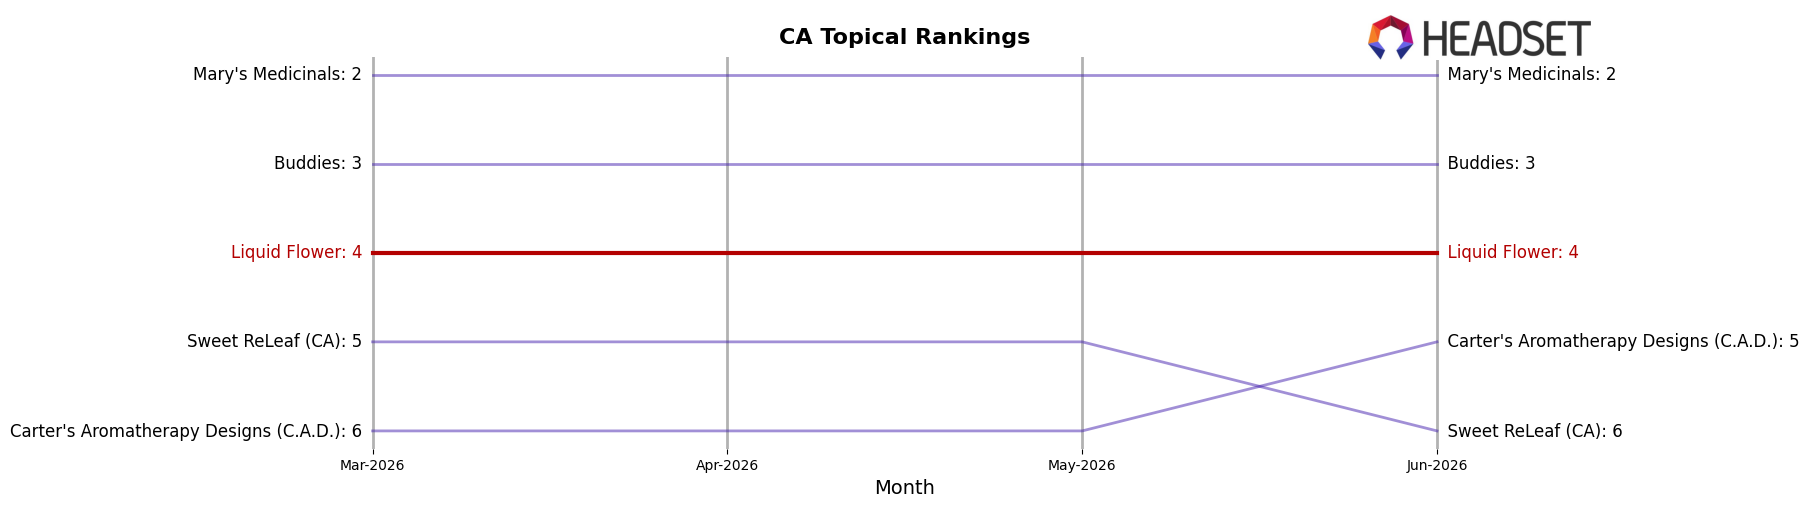
Liquid Flower sits at rank #4 in CA Topical in June 2026, improving 2 positions from #6 year over year and holding flat versus March 2026 at #4, while the category’s top tier is reshuffling as Buddies held #3 with a 64.48% YoY sales increase and Carter's Aromatherapy Designs (C.A.D.) slid from #4 to #5 on a 22.22% YoY decline; at the summit, Papa & Barkley stayed #1 despite a 4.58% YoY contraction, and Mary's Medicinals remained #2 with a 26.67% YoY drop, indicating the #4 placement is less about category-wide expansion and more about holding share amid mixed competitor momentum and suggests Liquid Flower’s rank trajectory points to a defensible position just below a softening top two and a rapidly advancing #3.
Notable Products
Original Whipped Body Butter (10mg CBD, 10mg CBDA, 180mg THC, 180mg THCA, 59ml) posted the largest month-over-month rebound at +86.9% while rising to rank 4, contrasting with Deep Muscle Relief & Detox Mineral Bath Soak (300mg) which fell -57.0% to rank 8; this flip suggests shoppers traded into richer-body formats over soaking SKUs. Despite Deep Relief Balm (40mg CBD, 40mg CBDa, 400mg THC, 400mg THCa, 59ml, 2oz) holding rank 1 with $23,214 in June 2026, it slid -22.5% MoM as the adjacent Deep Relief Topical (38mg THC, 1mg CBG, 4.5mg CBD, 5ml) at rank 2 also declined -10.6%, indicating leader-weighted softness within the flagship pain-relief line. Four of the top ten are Deep Relief family SKUs, and three of those posted MoM drops between -22.8% and -26.0%, pointing to concentration risk if the legacy relief franchise continues to contract while body-care formats gain share. The pattern implies Liquid Flower’s commercial direction is pivoting from concentrated relief formats toward replenishable body-care textures where volatility can convert into sustainable rank gains.
Top Selling Cannabis Brands
Data for this report comes from real-time sales reporting by participating cannabis retailers via their point-of-sale systems, which are linked up with Headset’s business intelligence software. Headset’s data is very reliable, as it comes digitally direct from our partner retailers. However, the potential does exist for misreporting in the instance of duplicates, incorrectly classified products, inaccurate entry of products into point-of-sale systems, or even simple human error at the point of purchase. Thus, there is a slight margin of error to consider. Brands listed on this page are ranked in the top twenty within the market and product category by total retail sales volume.

