.svg)

Sep-2026
Sales
Trend
6-Month
Product Count
SKUs
Avg Price
YoY Sales Change
YoY Price Change


Where to Buy
Autumn Brands is stocked at 152 licensed dispensaries across California, with the deepest coverage in Los Angeles, San Diego, San Francisco, San Jose, and Vista. Search by ZIP code or city below to find the closest one, or filter by product type if you are after a specific format.
Market Insights Snapshot
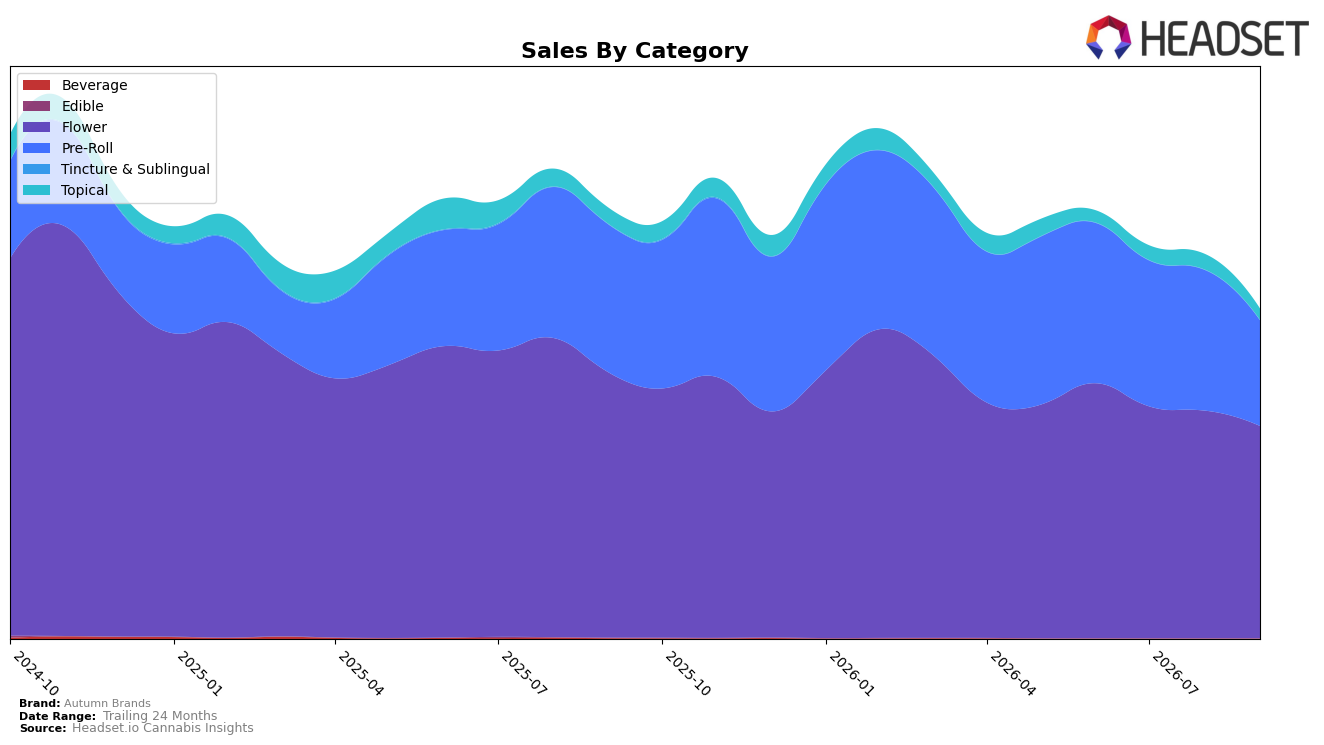
Autumn Brands concentrated 64.55% of September 2026 sales in Flower while Pre-Roll held 32.09% and Topical 3.36%, yet Flower declined 20.07% year over year and 6.76% month over month as Pre-Roll fell 28.62% YoY and 24.94% MoM. Average price fell 11.13% YoY to $18.67 while Flower’s category ticket sat at $30.02, indicating the mix shift did not offset unit pressure; with Topical also down 30.45% YoY and 27.91% MoM, the aggregate -23.53% YoY brand sales change and -31.09% over 24 months point to category breadth not cushioning downside. The pattern implies concentration in Flower with simultaneous declines across all categories is amplifying volatility rather than stabilizing revenue.
Within California Flower, Autumn Brands sat at rank 78 in September 2026 while Flower share remained high at 64.55% and Pre-Roll contracted 24.94% MoM, a combination that reduces visibility in a rank-driven shelf environment. With Pre-Roll and Topical shrinking faster than Flower by 8.56 and 7.85 percentage points YoY respectively, the portfolio is ceding diversity that could buffer rank swings; given average prices of $30.02 in Flower and $10.38 in Pre-Roll, the heavier mix into higher-ticket Flower does not compensate for volume erosion at rank 78. The implication is that without stabilizing Pre-Roll contribution or improving Flower velocity at the current rank, Autumn Brands is positioned for continued share pressure within California.
Competitive Landscape
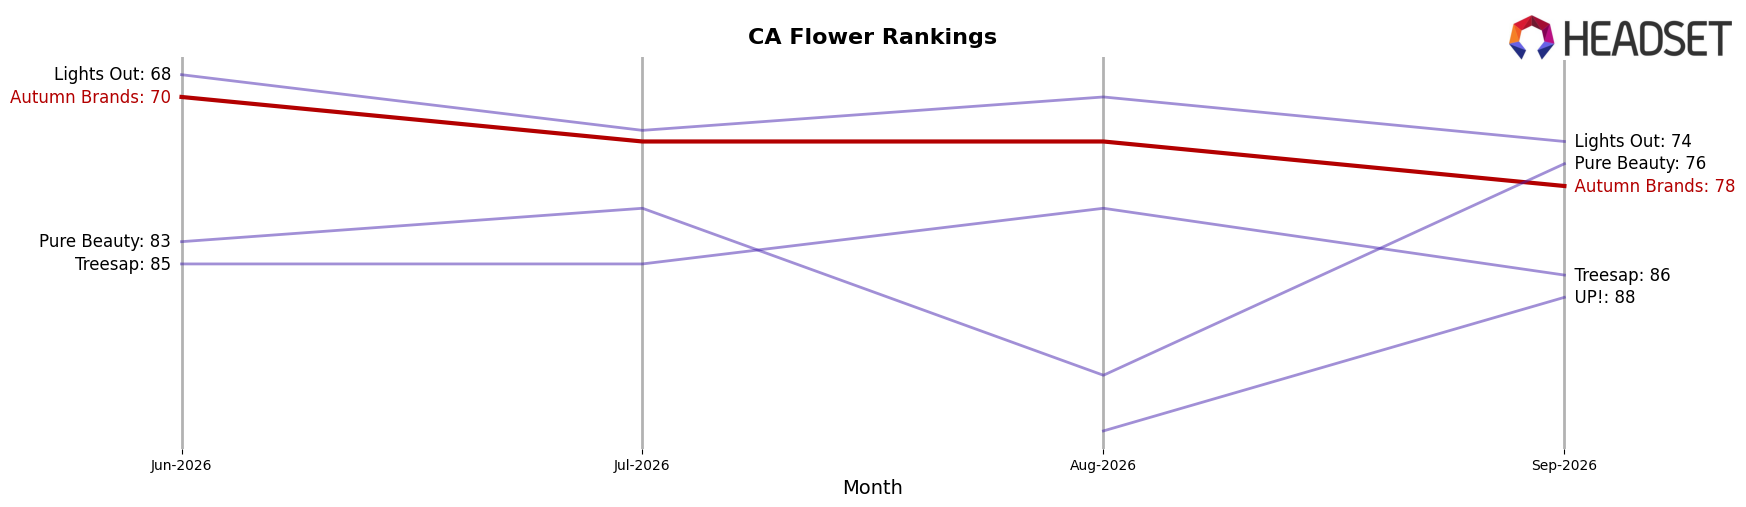
Autumn Brands sits at rank #78 in CA Flower for September 2026, down 8 positions year over year from #70, and 8 positions lower than June 2026 when it was also at #70; the brand’s peak of #58 in February 2026 underscores a 20-rank slide from that high to the current month. In contrast, STIIIZY advanced from #2 to #1 while growing sales by 47.8%, and Oakfruitland climbed from #11 to #5 with a 73.5% sales increase, whereas CannaBiotix (CBX) fell from #1 to #3 alongside a 21.1% sales decline; the directional mix among leaders indicates that Autumn Brands’ downward rank trend is more aligned with share erosion than with a broad category contraction, implying the brand must regain velocity to reverse a multi-month slide.
Notable Products
Motion Party Pre-Roll (1g) posted the sharpest movement in September 2026 with a -60.1% month-over-month decline, sliding to rank 8, while Mango Haze Pre-Roll (1g) also contracted by -20.1% at rank 4. In contrast, Mule Fuel Pre-Roll (1g) gained 10.6% month over month to rank 2, and Blue Dream (3.5g) fell -24.5% to rank 6. With eight of the top ten products in September 2026 sitting in Pre-Roll, the category concentration alongside a severe drop at rank 8 implies SKU rationalization pressure in Pre-Roll and a need to rebalance toward steadier Flower positions.
Top Selling Cannabis Brands






Data for this report comes from real-time sales reporting by participating cannabis retailers via their point-of-sale systems, which are linked up with Headset’s business intelligence software. Headset’s data is very reliable, as it comes digitally direct from our partner retailers. However, the potential does exist for misreporting in the instance of duplicates, incorrectly classified products, inaccurate entry of products into point-of-sale systems, or even simple human error at the point of purchase. Thus, there is a slight margin of error to consider. Brands listed on this page are ranked in the top twenty within the market and product category by total retail sales volume.

