.svg)


Market Insights Snapshot
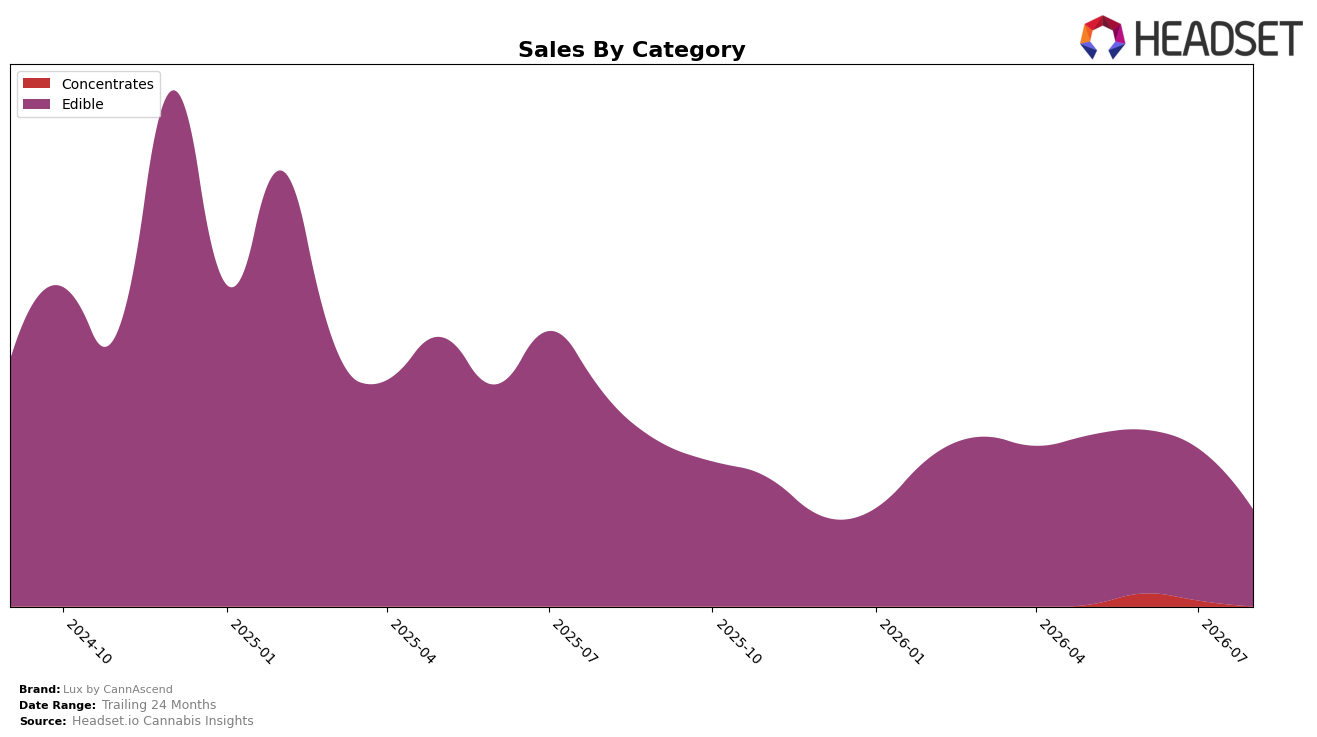
In August 2026, Lux by CannAscend operated as a single-category brand with Edible at 100.0% of mix and a month-over-month decline of 36.33% alongside a year-over-year drop of 54.48%. Average price rose 25.41% year over year to $18.68 while total brand sales fell 54.48%, indicating volume contraction outpaced any price lift. With Maryland as the top state and Edible as the sole category, the absence of rank data in Edible leaves competitive standing unclear, but the scale of the 36.33% MoM drop paired with a 54.48% YoY decline implies a shrinking buyer base that price increases did not offset.
The consolidation into 100.0% Edible, coupled with a 25.41% YoY price increase and simultaneous 54.48% YoY sales decline, signals trade-down or reduced purchase frequency that erodes volume faster than pricing can recover, which weakens positioning within Edibles in Maryland. Given the 36.33% MoM retreat on a fully concentrated mix, the brand lacks category diversification to buffer volatility, implying that August 2026 performance hinged on a single demand pocket where price elasticity and tighter shopper cohorts likely compressed rank trajectory even if the precise rank is unavailable.
Competitive Landscape
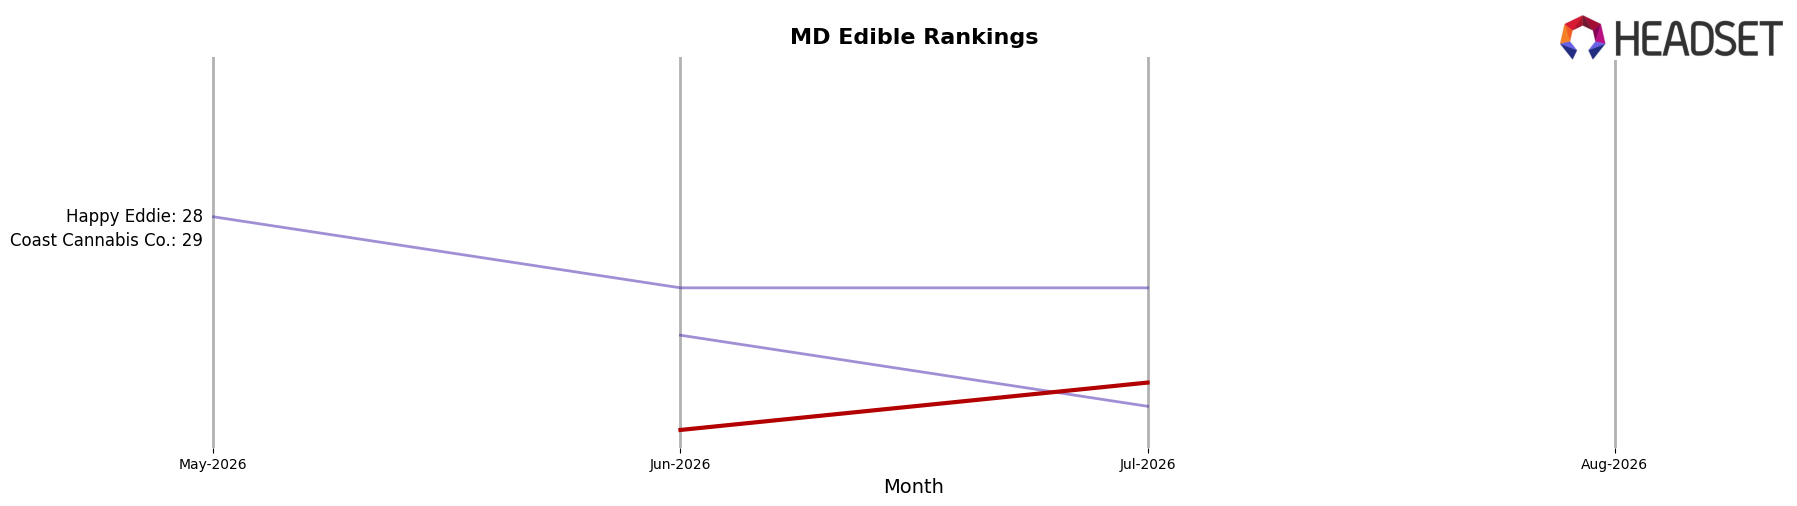
Lux by CannAscend sits at rank 37 in MD Edible for August 2026, improving 4 positions from rank 41 in May 2026, yet still 12 places below its peak rank of 25 from February 2025; the absence of a reported year-over-year rank leaves the 12-month trajectory unclear, but the quarter-over-quarter gain contrasts with a longer-term slide. Against leaders, Incredibles holds rank 1 with a year-over-year climb of 3 positions and sales up 46.3%, while Wyld sits at rank 4 after a 1-position gain despite a 28.7% sales decline, indicating that top-tier ranking has decoupled from pure sales growth. This mix—near-term rank recovery of 4 spots alongside a 12-place gap from prior peak and competitors maintaining top-5 ranks despite divergent sales trends—implies Lux by CannAscend is stabilizing tactically in the mid-tier but needs sustained share capture to re-enter the top 25.
Notable Products
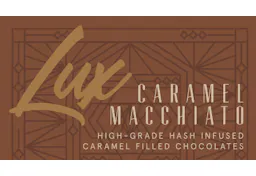
Butter Rum Milk Chocolate Caramels 10-Pack (100mg) posted the steepest decline in August 2026 at -66.9% MoM while dropping to rank 2, and Caramel Macchiato Milk Chocolates Truffles 10-Pack (100mg) fell -56.4% MoM at rank 4; by contrast, Sour Cherry Lemonade Live Rosin Gummies 5-Pack (100mg) slid a milder -6.3% MoM but held rank 1. Four of the top ten are chocolate caramel SKUs, yet three of those registered double-digit MoM declines between -42.98% and -66.9%, indicating portfolio risk concentrated in a weakening chocolate format. The lone gainer cohort is absent, and new entries without MoM history occupy ranks 3 and 8, suggesting reliance on pipeline refresh rather than repeat velocity. The pattern implies Lux by CannAscend is shifting toward live rosin gummies for stability while chocolate caramels require reformulation, pricing, or promotional recalibration.
Top Selling Cannabis Brands






Data for this report comes from real-time sales reporting by participating cannabis retailers via their point-of-sale systems, which are linked up with Headset’s business intelligence software. Headset’s data is very reliable, as it comes digitally direct from our partner retailers. However, the potential does exist for misreporting in the instance of duplicates, incorrectly classified products, inaccurate entry of products into point-of-sale systems, or even simple human error at the point of purchase. Thus, there is a slight margin of error to consider. Brands listed on this page are ranked in the top twenty within the market and product category by total retail sales volume.

