.svg)

Sep-2026
Sales
Trend
6-Month
Product Count
SKUs
Avg Price
YoY Sales Change
YoY Price Change


Where to Buy
Dialed In Gummies is stocked at 647 licensed dispensaries across Colorado, Missouri, and 5 other states, 300 of them in Colorado, with the deepest coverage in Denver, Colorado Springs, Boulder, Aurora, and Grand Junction. Search by ZIP code or city below to find the closest one, or filter by product type if you are after a specific format.
Market Insights Snapshot
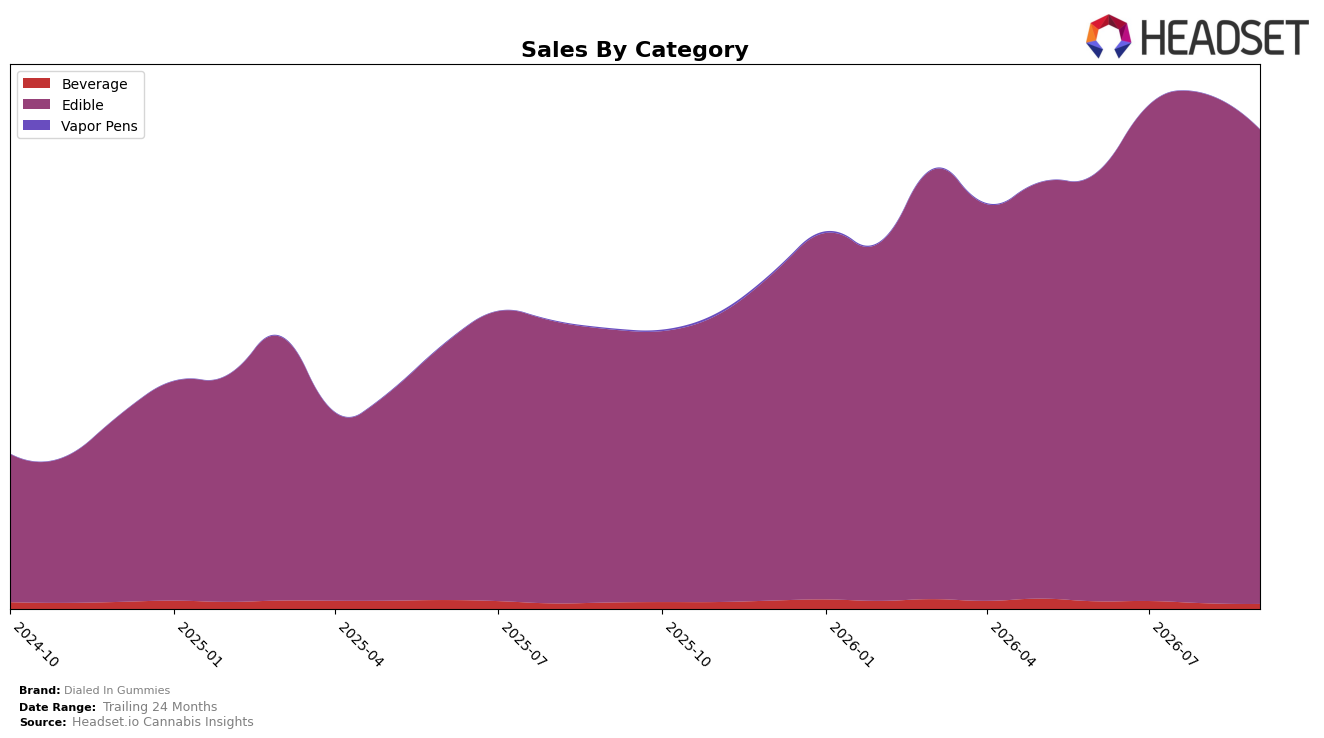
Edible accounted for 98.97% share in September 2026 while Beverage held 1.03%, with Edible up 73.71% year over year but down 6.87% month over month, and Beverage down 22.40% year over year and down 12.57% month over month. Average price fell 6.79% year over year to $20.42 while Edible pricing sat at $20.50, indicating volume-led growth alongside a category mix that is concentrating further into Edible. With Edible ranked 3 in Colorado and total brand sales up 71.06% year over year, the combination of rising Edible volume and a shrinking Beverage slice implies a deliberate specialization toward high-velocity Edible SKUs rather than a balanced multi-category footprint.
The mix shift toward a 98.97% Edible share alongside a 6.87% month-over-month Edible decline and a 12.57% month-over-month Beverage decline implies that short-term softness is cyclical rather than mix-dilutive, as the smallest category is contracting faster. Holding rank 3 in Colorado Edible while Beverage is down 22.40% year over year suggests that category leadership depends on sustaining Edible velocity even if Beverage experimentation tapers. The year-over-year Edible growth of 73.71% paired with a 6.79% price decrease indicates elastic demand supporting share defense via value, implying Dialed In Gummies is trading price for penetration within Edible while letting Beverage recede without jeopardizing core positioning.
Competitive Landscape
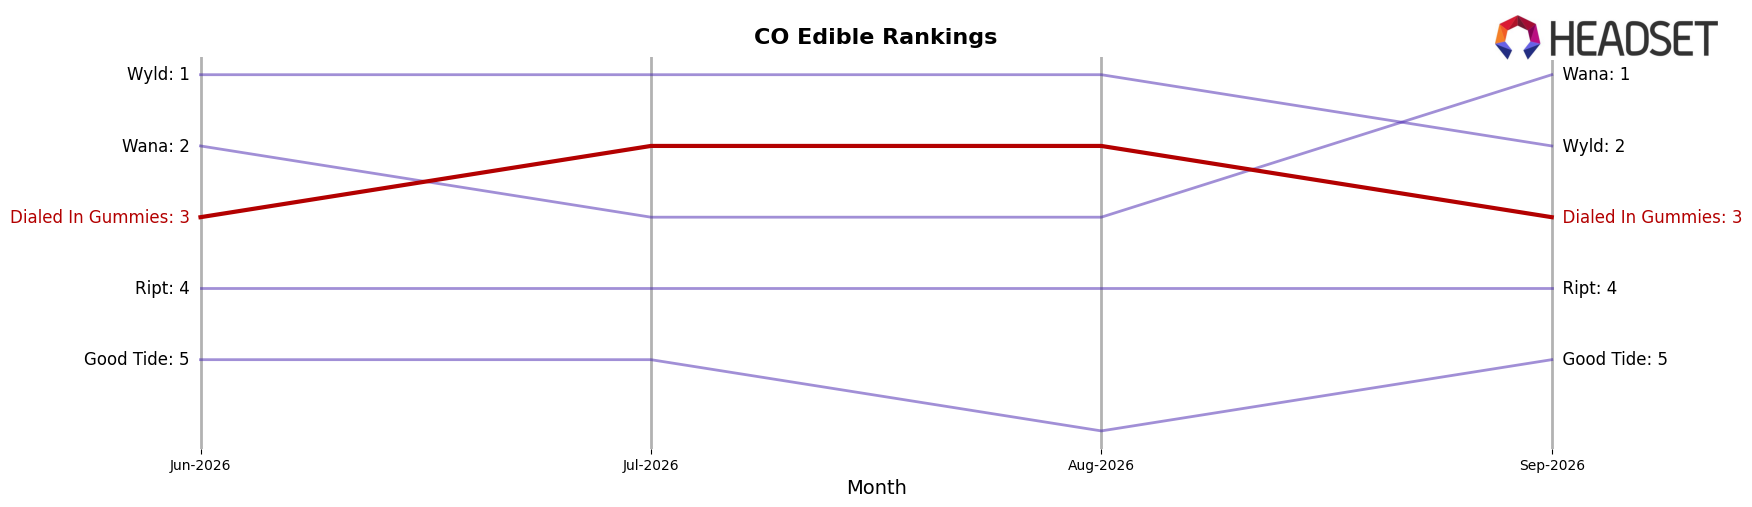
Dialed In Gummies holds rank 3 in September 2026, unchanged YoY from rank 3, and maintained rank 3 over the last three months while peaking at rank 2 in August 2026; this stability contrasts with Wana moving from rank 2 to rank 1 alongside a 10.5% YoY sales increase and Wyld sliding from rank 1 to rank 2 with a 23.8% YoY sales decline. Against the next-tier competitor, Ript remains at rank 4 with a 31.2% YoY sales drop while Good Tide stays at rank 5 with a 14.0% YoY decline, indicating pressure is concentrated above rather than below; the pattern implies Dialed In Gummies is boxed into a stable third position, with upside contingent on displacing a weakening number 2 rather than defending against lower-ranked brands.
Notable Products
Classic - Starfruit Rosin Gummies 10-Pack (100mg) posted the steepest pullback at -16.4% MoM while holding rank 10, and Classic - Lux Cherry Rosin Gummies 10-Pack (100mg) fell -16.0% MoM at rank 4, indicating the Classic flavor set is losing momentum relative to the rest of the lineup. The leader, CBD/THC/CBN 1:1:1 Acai Berry Sleep Rosin Gummies 10-Pack (100mg CBD, 100mg THC, 100mg CBN), dropped -105.6% MoM yet stayed at rank 1, a disconnect that implies either out-of-stocks or a channel reset rather than a demand shift. Mid-tier functionality also softened, with Focus - THCV/CBC/THC 1:1:1 Blood Orange Rosin Gummies 20-Pack (100mg THCV, 100mg CBC, 100mg THC) down -13.5% MoM at rank 5 while the 10-Pack variant entered at rank 9, suggesting format fragmentation is diluting velocity per SKU even as four of the top ten are Classic SKUs. Overall, September 2026 product mix points to concentration in functional and Classic lines but with declining MoM across formats, implying Dialed In Gummies is trading depth for breadth and may need to rationalize pack sizes to recover rank stability and revenue density.
Top Selling Cannabis Brands






Data for this report comes from real-time sales reporting by participating cannabis retailers via their point-of-sale systems, which are linked up with Headset’s business intelligence software. Headset’s data is very reliable, as it comes digitally direct from our partner retailers. However, the potential does exist for misreporting in the instance of duplicates, incorrectly classified products, inaccurate entry of products into point-of-sale systems, or even simple human error at the point of purchase. Thus, there is a slight margin of error to consider. Brands listed on this page are ranked in the top twenty within the market and product category by total retail sales volume.

