Market Insights Snapshot
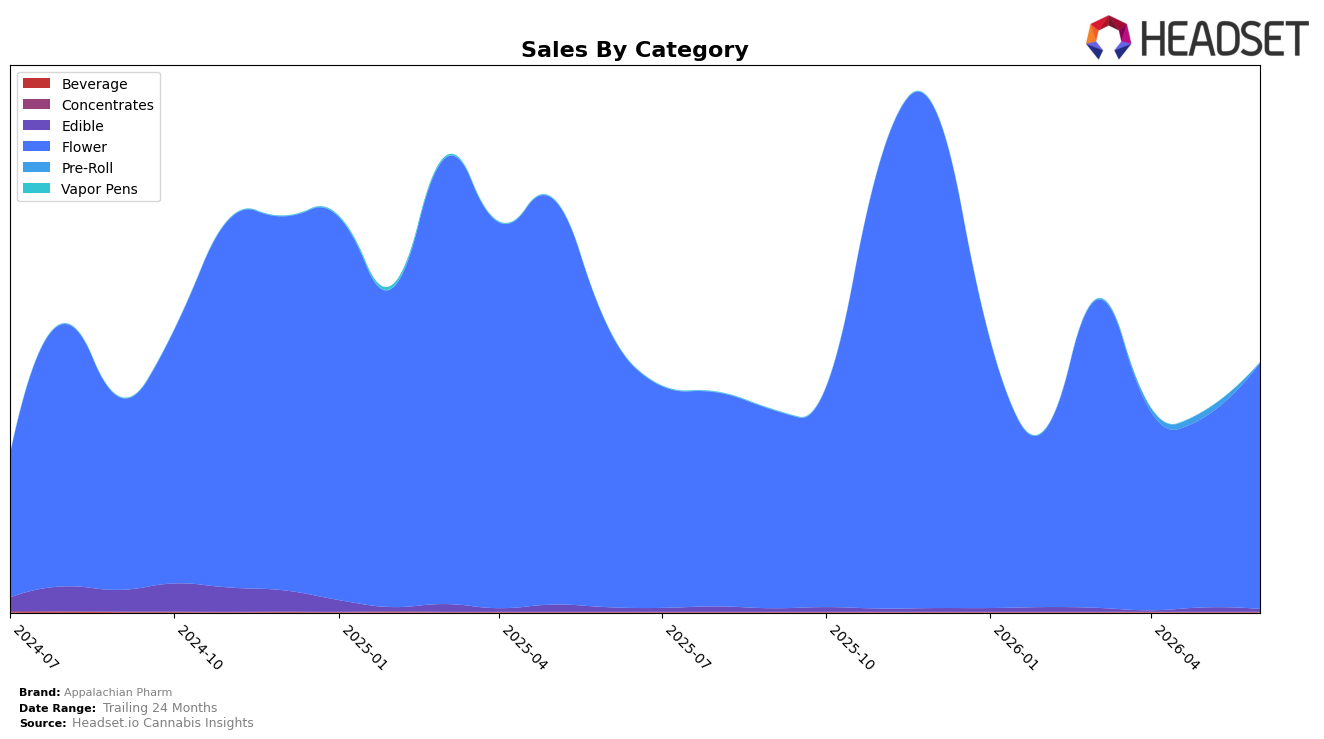
In June 2026, Appalachian Pharm concentrated 99.05% of sales in Flower, with Edible at 0.95% share; within that mix, Flower grew 29.31% month over month but fell 11.99% year over year, while Edible declined 40.68% MoM and 43.35% YoY. The average price rose 43.25% YoY to $46.91, aligning with a Flower average price of 47.82, as total brand sales declined 12.46% YoY despite a 23.05% gain over 24 months; the thesis is that a price-led, Flower-heavy portfolio lifted short-term volume but compressed annual comparables due to category overexposure and Edible contraction.
The category skew places Appalachian Pharm at rank 23 in Ohio Flower, implying mid-pack visibility where a 29.31% MoM Flower rebound can move rank only marginally without diversification, while a 0.95% Edible share limits cross-category discovery. With Flower YoY at -11.99% alongside Edible YoY at -43.35%, the portfolio risk is concentrated; the implication is that sustaining position 23 in Ohio requires either maintaining the higher price point with tighter Edible rationalization or reallocating mix to categories that can offset Flower’s annual drag without eroding the 23.05% two-year sales trajectory.
Competitive Landscape
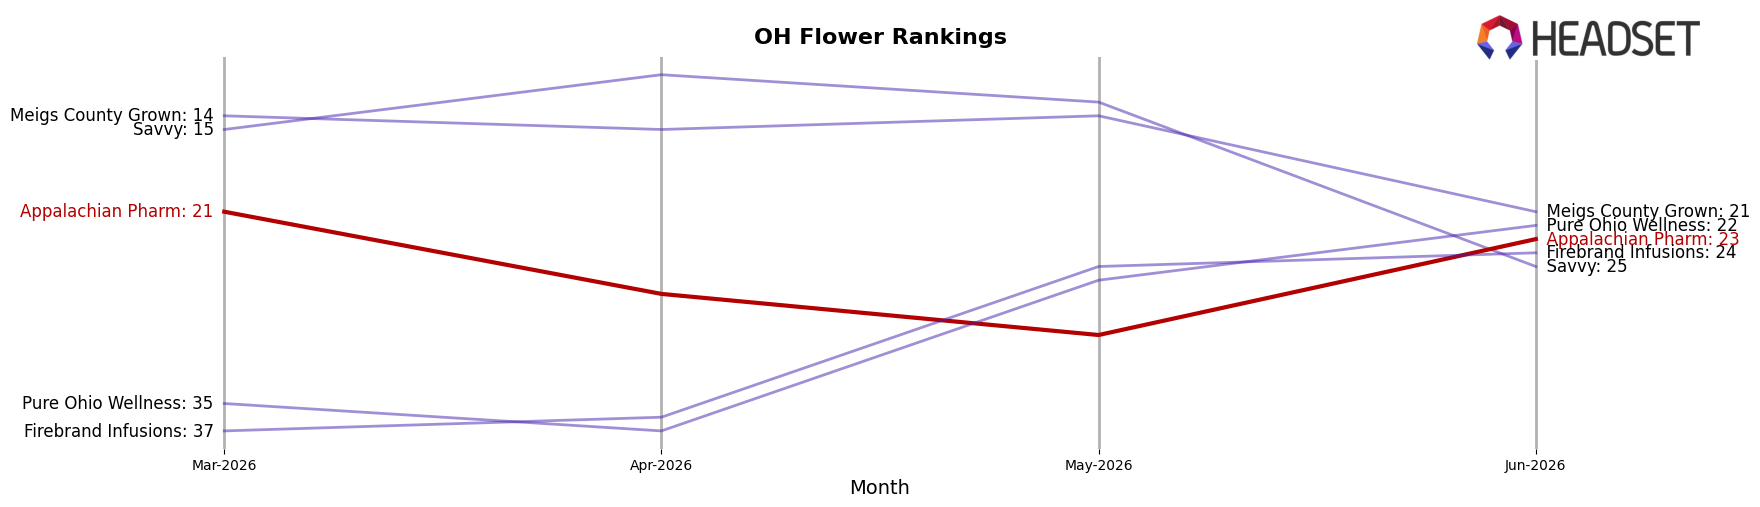
Appalachian Pharm sits at rank #23 in OH Flower in June 2026, down 2 positions year over year from #21 and also 2 spots lower than its March 2026 mark of #21, while its historical peak was #13 in June 2024. In contrast, Klutch Cannabis climbed to #1 from #20 alongside a 304.8% year-over-year sales change, and RYTHM advanced to #3 from #6 with a 67.7% sales increase, whereas Riviera Creek held #2 despite a 22.7% sales decline and Buckeye Relief slipped in sales by 19.5% while ranking #4. The combination of a 2-rank year-over-year drop and a 2-rank slide versus three months ago, against competitors moving up multiple ranks or defending top-5 positions, implies Appalachian Pharm is losing relative shelf momentum and must regain share to avoid further drift from its prior peak.
Notable Products
Green Galaxy (3.5g) posted the standout move in June 2026 with a 387.7% month‑over‑month surge to rank 7, while Jet Fuel (3.5g) also accelerated 122.1% MoM to rank 1, implying a pivot toward momentum SKUs at both the top and mid-pack. At the same time, Def D (2.83g) fell 65.7% MoM at rank 6 and Gelonade (3.5g) dropped 43.3% MoM at rank 9, whereas Strawberry Kushmints (3.5g) slid 14.5% MoM at rank 2, indicating quality dispersion within the Flower lineup. Four of the top ten are 3.5g Flower SKUs and three are 2.83g, with large-format 14.15g entries holding ranks 5 and 8, signaling a barbell between premium eighths and value ounces. The mix points to Appalachian Pharm leaning into high-velocity 3.5g winners while pruning underperforming small formats to stabilize rank position breadth.
Top Selling Cannabis Brands
Data for this report comes from real-time sales reporting by participating cannabis retailers via their point-of-sale systems, which are linked up with Headset’s business intelligence software. Headset’s data is very reliable, as it comes digitally direct from our partner retailers. However, the potential does exist for misreporting in the instance of duplicates, incorrectly classified products, inaccurate entry of products into point-of-sale systems, or even simple human error at the point of purchase. Thus, there is a slight margin of error to consider. Brands listed on this page are ranked in the top twenty within the market and product category by total retail sales volume.

