May-2026
Sales
Trend
6-Month
Product Count
SKUs
Avg Price
YoY Sales Change
YoY Price Change
Market Insights Snapshot
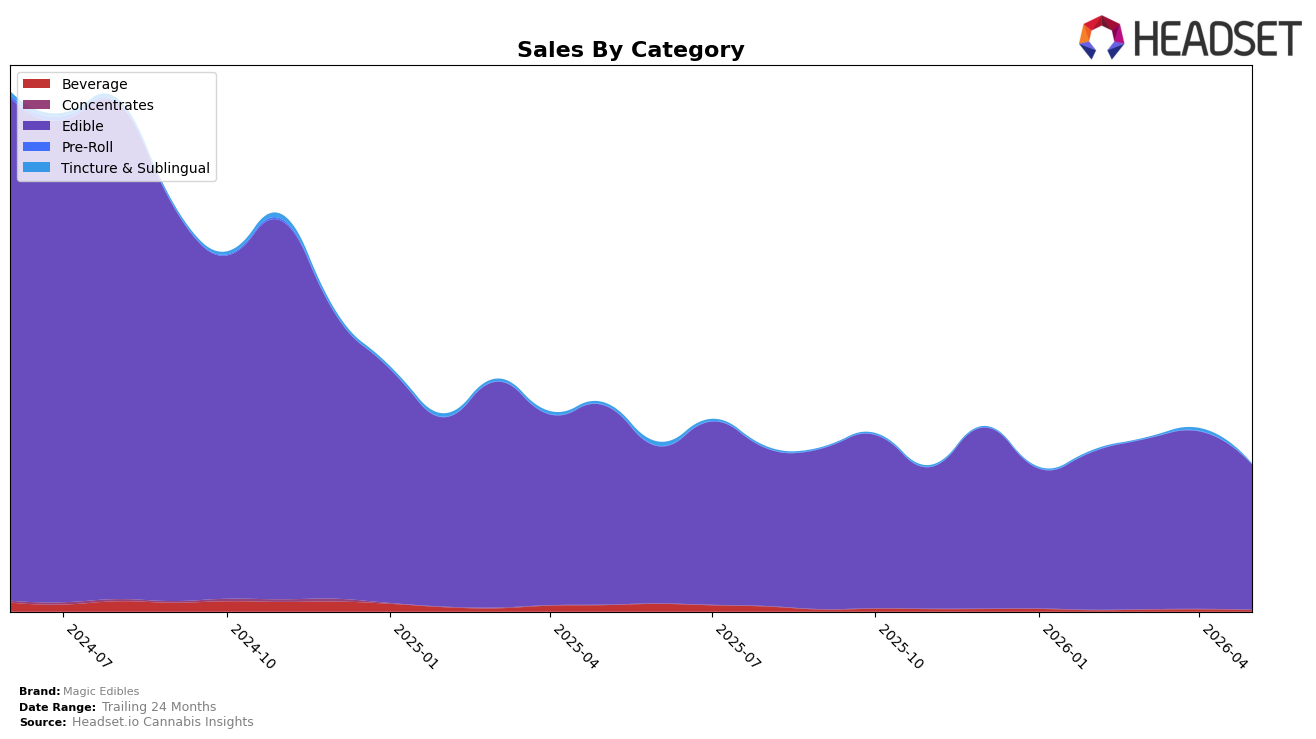
Magic Edibles concentrated 99.06% of May 2026 revenue in Edible, with Beverage at 0.84% and Tincture & Sublingual at 0.10%, indicating near-single-category reliance. Edible declined 27.32% year over year and 18.35% month over month, while Beverage contracted 80.02% YoY and 36.51% MoM, and Tincture & Sublingual fell 92.76% YoY and 94.07% MoM. With brand-level sales down 29.52% YoY and average price down 19.69%, the mix tilt means price-led pressure in the dominant Edible lane is dictating overall movement; the implication is that dependency on Edible amplifies downside when that category underperforms both YoY and MoM.
At rank 33 in Edible in Michigan, the 18.35% MoM drop in the primary category alongside a 36.51% MoM decline in Beverage reduces optionality for offsetting losses, and the 94.07% MoM collapse in Tincture & Sublingual further removes a potential buffer. Given 99.06% share in Edible and a May 2026 average price of $2.27 versus materially higher price points in smaller categories, the pattern implies positioning centered on value Edibles, where marginal share or price shifts can swing total performance more than diversification moves could in the short term.
Competitive Landscape
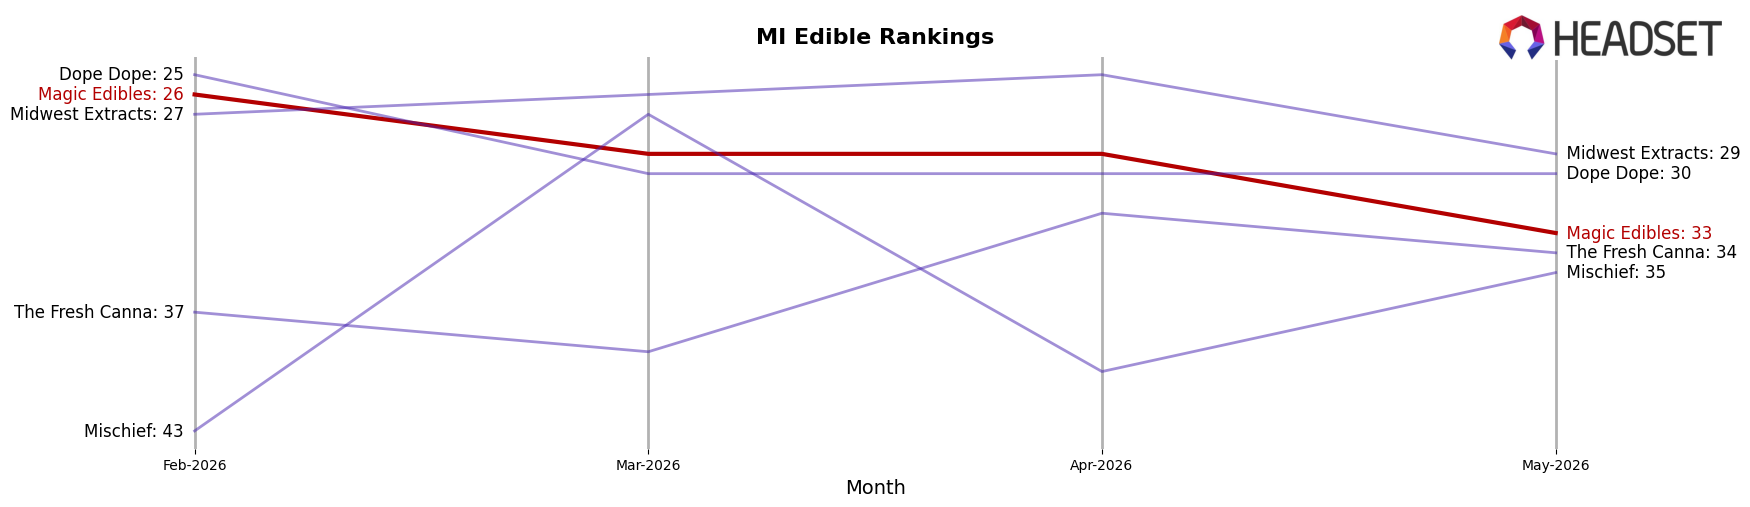
Magic Edibles sits at rank #33 in MI Edible for May 2026, down 7 positions year over year from #26 and also 7 positions below its February 2026 mark of #26, while its historical peak was #10 in June 2024; in contrast, Wyld held #1 both this year and last despite a 17.0% YoY sales decline, and Good Tide slipped from #4 to #5 alongside a 20.3% YoY sales drop, indicating that Magic Edibles’ rank erosion is more about relative share loss than a sector-wide pullback and implies a need to regain distribution or velocity to reverse the downward trajectory.
Notable Products
Lemonade Gummies 4-Pack (200mg) posted the steepest month-over-month drop in May 2026 at -29.5% while sliding to rank 3, and Watermelon Gummies 4-Pack (200mg) fell -30.4% at rank 5, indicating flavor fatigue concentrated in citrus and melon. In contrast, Pineapple Chews (200mg) jumped +44.6% to rank 1 with $23,749 in sales, and Orange Chews 4-Pack (200mg) held rank 2 with a -0.6% dip, signaling that chewy formats are outpacing gummies despite mixed flavor momentum. With eight of the top ten SKUs in the Edible category clustered in gummies or chews and two new or newly tracked items entering at ranks 7–8 while Grape Chews 4-Pack (200mg) declined -11.2% at rank 9, the mix points to rotation toward core chew propositions and away from certain gummy sub-flavors. The pattern implies Magic Edibles is consolidating around a few high-velocity chew leaders while pruning or reformulating underperforming gummy flavors to protect share.
Top Selling Cannabis Brands
Data for this report comes from real-time sales reporting by participating cannabis retailers via their point-of-sale systems, which are linked up with Headset’s business intelligence software. Headset’s data is very reliable, as it comes digitally direct from our partner retailers. However, the potential does exist for misreporting in the instance of duplicates, incorrectly classified products, inaccurate entry of products into point-of-sale systems, or even simple human error at the point of purchase. Thus, there is a slight margin of error to consider. Brands listed on this page are ranked in the top twenty within the market and product category by total retail sales volume.

