.svg)

Sep-2026
Sales
Trend
6-Month
Product Count
SKUs
Avg Price
YoY Sales Change
YoY Price Change


Where to Buy
Fresh Coast is stocked at 165 licensed dispensaries across Michigan, New Mexico, and Oklahoma, 162 of them in Michigan, with the deepest coverage in New Buffalo, Coldwater, Detroit, Flint, and Grand Rapids. Search by ZIP code or city below to find the closest one, or filter by product type if you are after a specific format.
Market Insights Snapshot
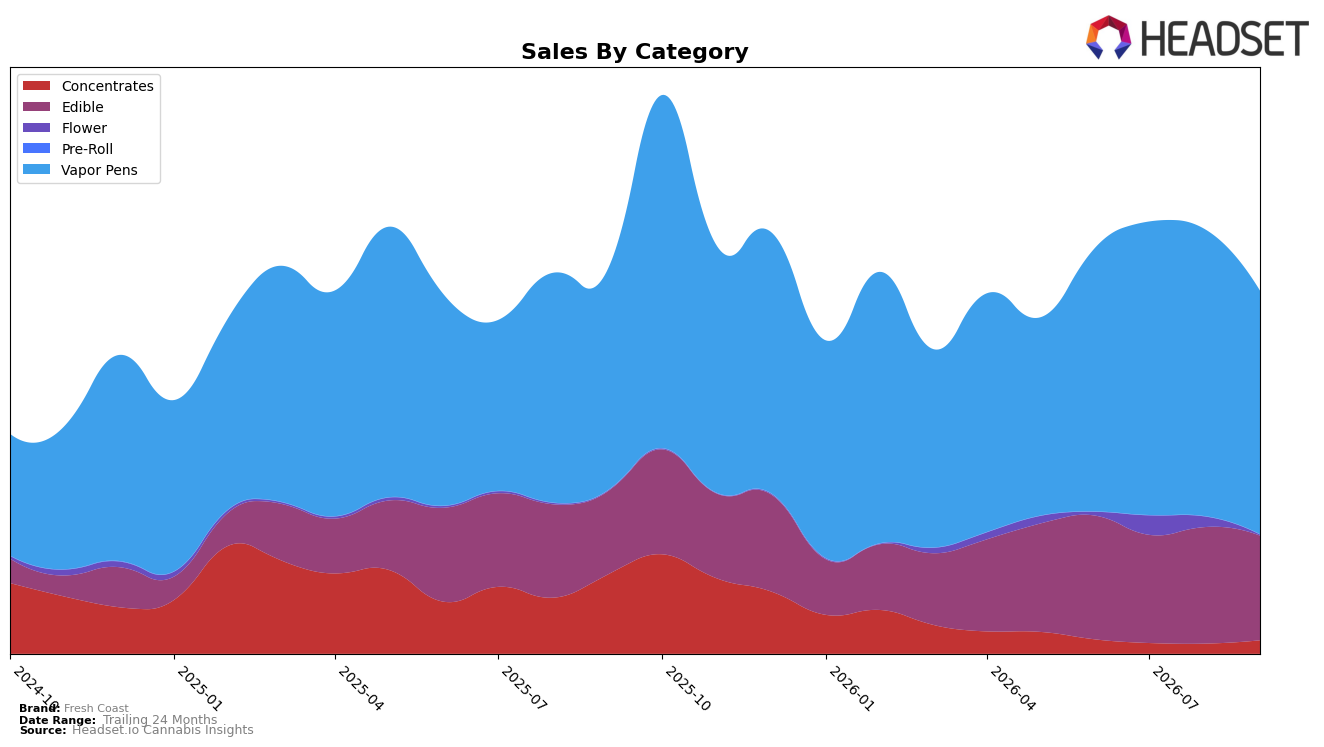
In September 2026, Fresh Coast leaned even harder into Vapor Pens at 67.28% share while Edible held 28.86% and Concentrates and Flower combined for 3.86%, indicating a concentrated portfolio despite mixed momentum. Vapor Pens posted 9.93% year-over-year growth but fell 15.18% month-over-month, while Edible grew 25.80% year-over-year and declined 10.20% month-over-month, and Concentrates plunged 83.33% year-over-year yet jumped 33.65% month-over-month. Average price rose 10.08% year-over-year to $10.04 as Vapor Pens pricing sat at $20.24, and Flower’s year-over-year was up 77.03% but month-over-month collapsed 92.80%, pointing to volatility at the fringes. With a rank of 14 in Vapor Pens in Michigan, the pattern implies Fresh Coast is trading near-term volume softness for price-led value capture in its core category while using Edible growth as a secondary stabilizer.
The combination of a 15.18% month-over-month drop in Vapor Pens and a 10.20% month-over-month decline in Edible, alongside a 33.65% month-over-month rebound in Concentrates from a deep year-over-year trough of 83.33%, suggests Fresh Coast is absorbing a seasonal or promotional reset while protecting margin via a 10.08% higher average price. Holding a 67.28% Vapor Pens mix with a rank of 14 in Michigan positions the brand as a category specialist rather than a portfolio balancer, and the 25.80% Edible year-over-year growth against a 9.93% Vapor Pens year-over-year lift indicates cross-category demand that can hedge rank risk without diluting the core. The pattern implies that sustaining share will hinge on reactivating month-over-month velocity in Vapor Pens while selectively scaling Edible to buffer volatility, rather than expanding low-share categories where swings like Flower’s 92.80% month-over-month decline can distort inventory efficiency.
Competitive Landscape
Fresh Coast sits at rank #14 in MI Vapor Pens in September 2026, unchanged year over year from #14, while slipping 1 position from #13 in June 2026 and down 5 spots from its peak at #9 in October 2025; by contrast, MKX Oil Company moved up from #3 to #1 with a 21.7% year-over-year sales increase, and Society C surged from #12 to #4 alongside a 276.2% year-over-year sales gain. Meanwhile, Muha Meds slid from #2 to #3 with a 27.7% year-over-year sales decline and Platinum Vape eased from #4 to #5 with a 1.4% year-over-year dip, indicating that Fresh Coast’s flat year-over-year rank and minor three-month pullback signal a brand holding share while faster-moving rivals are compressing the middle tier.

Notable Products
Ritual - Blood Orange Jellies 10-Pack (200mg) posted the steepest decline in September 2026 at -24.99% MoM while sliding to rank 10, and Ritual - Tropical Jellies 10-Pack (200mg) fell -22.64% MoM at rank 9, signaling a pullback in the Ritual sub-line even as Splash - CBN/THC 1:2 Blue Raspberry Live Resin Gummies 10-Pack (100mg CBN, 200mg THC) rose +16.16% MoM at rank 2. Four of the top ten are THCV or CBN ratio Splash gummies concentrated in Edibles, but the category leader Splash - CBN/THC 1:2 Mixed Berry Live Resin Gummies 10-Pack (100mg CBN, 200mg THC) dropped -15.64% MoM at rank 1 alongside a -8.32% MoM dip for Splash - THC/CBN 2:1 Blueberry Live Resin Gummies 10-Pack (200mg THC, 100mg CBN) at rank 3, implying rotation within functional ratios rather than category expansion, with dollars consolidating around fewer SKUs near the top.
Top Selling Cannabis Brands






Data for this report comes from real-time sales reporting by participating cannabis retailers via their point-of-sale systems, which are linked up with Headset’s business intelligence software. Headset’s data is very reliable, as it comes digitally direct from our partner retailers. However, the potential does exist for misreporting in the instance of duplicates, incorrectly classified products, inaccurate entry of products into point-of-sale systems, or even simple human error at the point of purchase. Thus, there is a slight margin of error to consider. Brands listed on this page are ranked in the top twenty within the market and product category by total retail sales volume.

