.svg)

Sep-2026
Sales
Trend
6-Month
Product Count
SKUs
Avg Price
YoY Sales Change
YoY Price Change


Where to Buy
Micro Bar is stocked at 469 licensed dispensaries across California, Washington, and 3 other states, 215 of them in California, with the deepest coverage in Sacramento, Los Angeles, San Diego, Santa Rosa, and Long Beach. Search by ZIP code or city below to find the closest one, or filter by product type if you are after a specific format.
Market Insights Snapshot
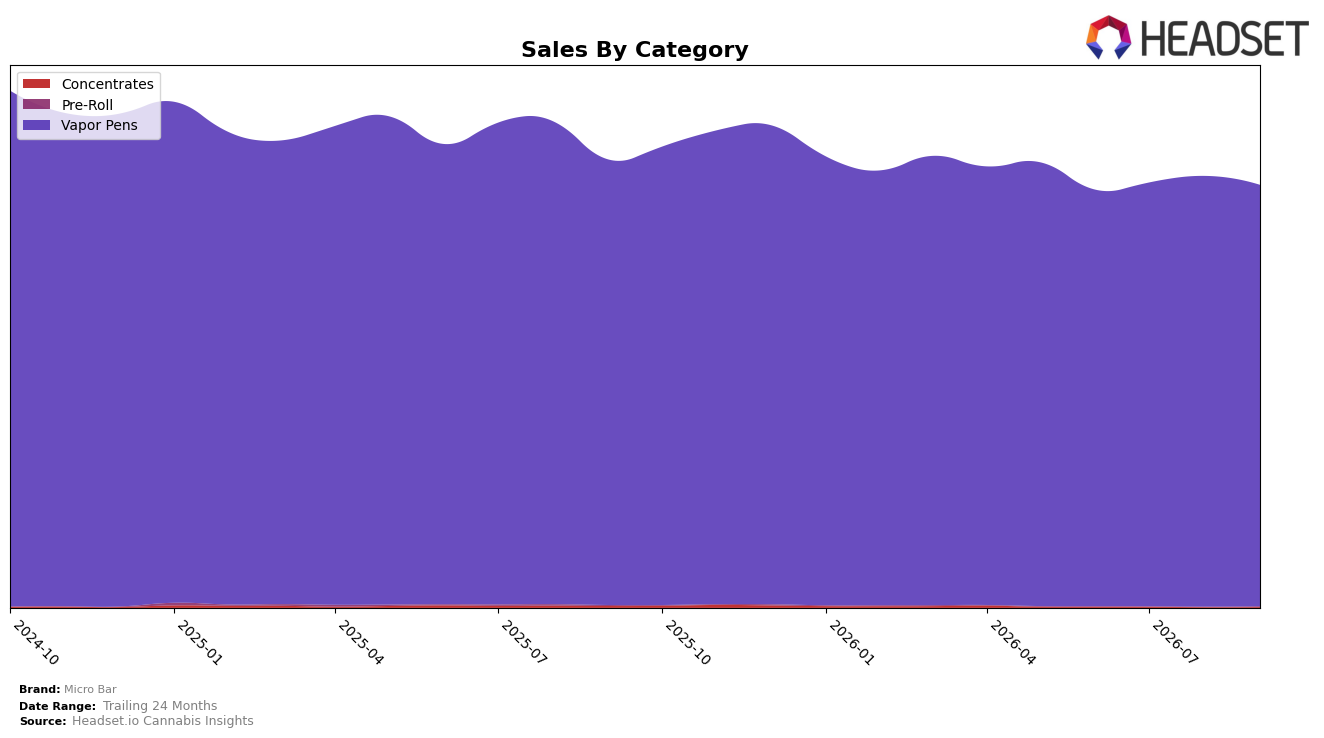
In September 2026, Micro Bar’s mix remained overwhelmingly concentrated in Vapor Pens at 99.85% share, with Vapor Pens down 5.43% year over year and down 2.17% month over month, while Concentrates held 0.08% share with a 74.51% year-over-year decline but a 43.56% month-over-month rise. Pre-Roll accounted for 0.07% share with a 41.99% year-over-year decline and no recorded month-over-month figure, and the brand’s average price fell 2.06% year over year to $24.09. With a Vapor Pens rank of 6 in Washington, the pattern implies Micro Bar is tightly tethered to a single category where small monthly contractions directly transmit to total brand performance, while nascent recovery signs in Concentrates are too small in share to offset the core softness.
The near-total reliance on Vapor Pens at 99.85% share combined with a 5.43% year-over-year decline and 2.17% month-over-month slippage, alongside a 2.06% price decrease, implies Micro Bar is competing on throughput rather than premium, leaving limited insulation from category downdrafts. The 43.56% month-over-month uptick in Concentrates off a 0.08% base and the 41.99% year-over-year drop in Pre-Roll suggest peripheral categories are not yet viable hedges; maintaining a Vapor Pens rank of 6 in Washington indicates stable placement but concentrated risk, implying the brand’s positioning is efficient within its niche yet exposed to category volatility until secondary lines scale.
Competitive Landscape
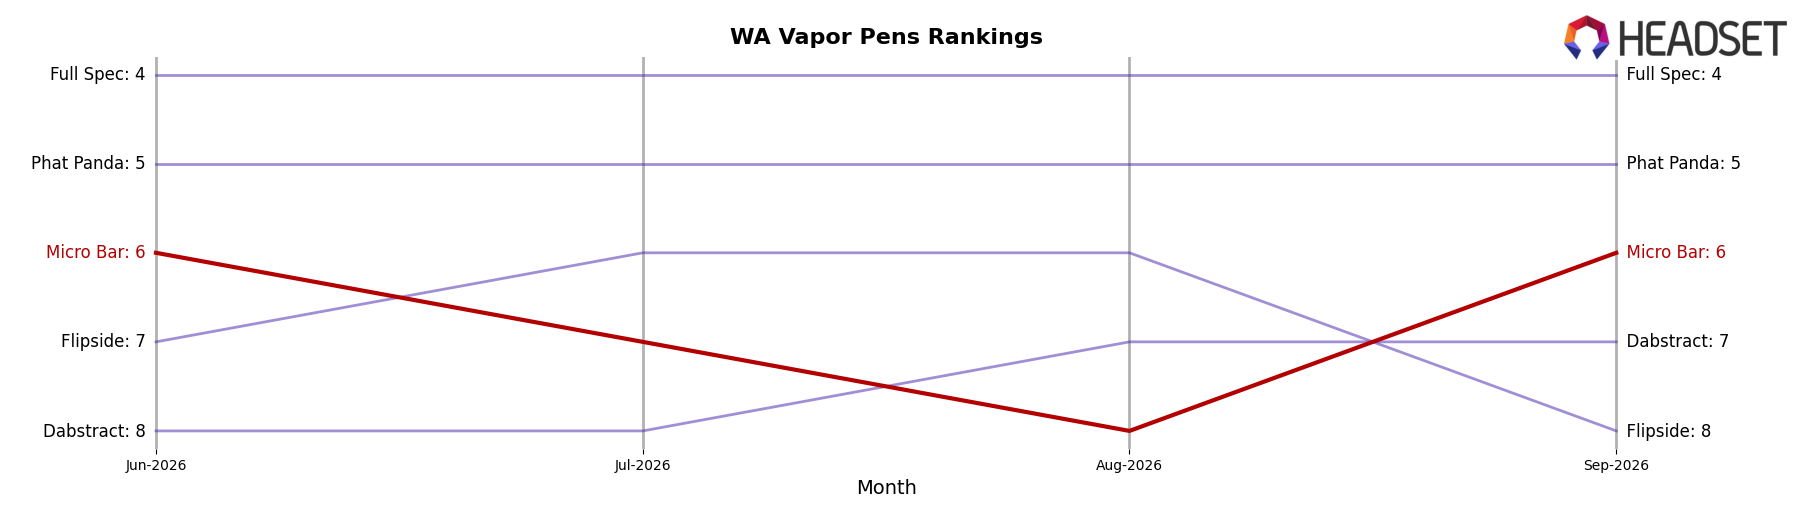
Micro Bar sits at rank #6 in WA Vapor Pens in September 2026, down 1 position from #5 year over year, and unchanged from June 2026 at #6, while its historical peak was #4 in October 2025. In contrast, Crystal Clear climbed from #3 to #1 year over year with a 26.4% sales growth, and Phat Panda fell from #2 to #5 with a 25.1% sales decline, placing Micro Bar behind a leader gaining share and ahead of a peer losing momentum. With Mfused sliding from #1 to #2 on a 30.9% sales drop while Plaid Jacket advanced from #6 to #3 on 23.3% growth, Micro Bar’s -1 rank move YoY and flat 3-month position imply a squeeze from above by faster risers and limited short-term upside without a catalyst.
Notable Products
Strawberry Mochi Live Resin Disposable (1g) posted the steepest pullback in September 2026 at -29.8% MoM while sliding to rank 10, alongside Pineapple Express Distillate Disposable (1g) at -14.5% MoM and rank 7; this dual decline against Blackberry Slush Live Resin Liquid Diamond Disposable (1g) holding rank 1 with -10.1% MoM implies a pivot away from select live resin and legacy flavor SKUs. Blue Hawaiian Punch Flavored Distillate Disposable (1g) rose +17.0% MoM at rank 3 while Melon Bar Distillate Disposable (1g) in rank 2 inched +1.7% MoM, and five of the top ten are Distillate SKUs, signaling demand concentration in flavored distillate formats over resin-led offerings. Blackberry Slush Live Resin Liquid Diamond Disposable (1g) still leads with $145,260 despite a -10.1% MoM dip and Watermelon Mimosa Distillate Disposable (1g) slid -4.9% at rank 5, indicating leadership is intact but momentum is shifting toward mid-pack, faster-growing distillate flavors. The mix points to Micro Bar leaning into high-velocity, flavored distillate pens while rationalizing slower live resin bets to defend share and margin.
Top Selling Cannabis Brands






Data for this report comes from real-time sales reporting by participating cannabis retailers via their point-of-sale systems, which are linked up with Headset’s business intelligence software. Headset’s data is very reliable, as it comes digitally direct from our partner retailers. However, the potential does exist for misreporting in the instance of duplicates, incorrectly classified products, inaccurate entry of products into point-of-sale systems, or even simple human error at the point of purchase. Thus, there is a slight margin of error to consider. Brands listed on this page are ranked in the top twenty within the market and product category by total retail sales volume.

