.svg)


Where to Buy
NUGZ FARM - Oregon is stocked at 57 licensed dispensaries across Oregon, with the deepest coverage in Portland, Bend, Ontario, Eugene, and Oregon City. Search by ZIP code or city below to find the closest one, or filter by product type if you are after a specific format.
Market Insights Snapshot
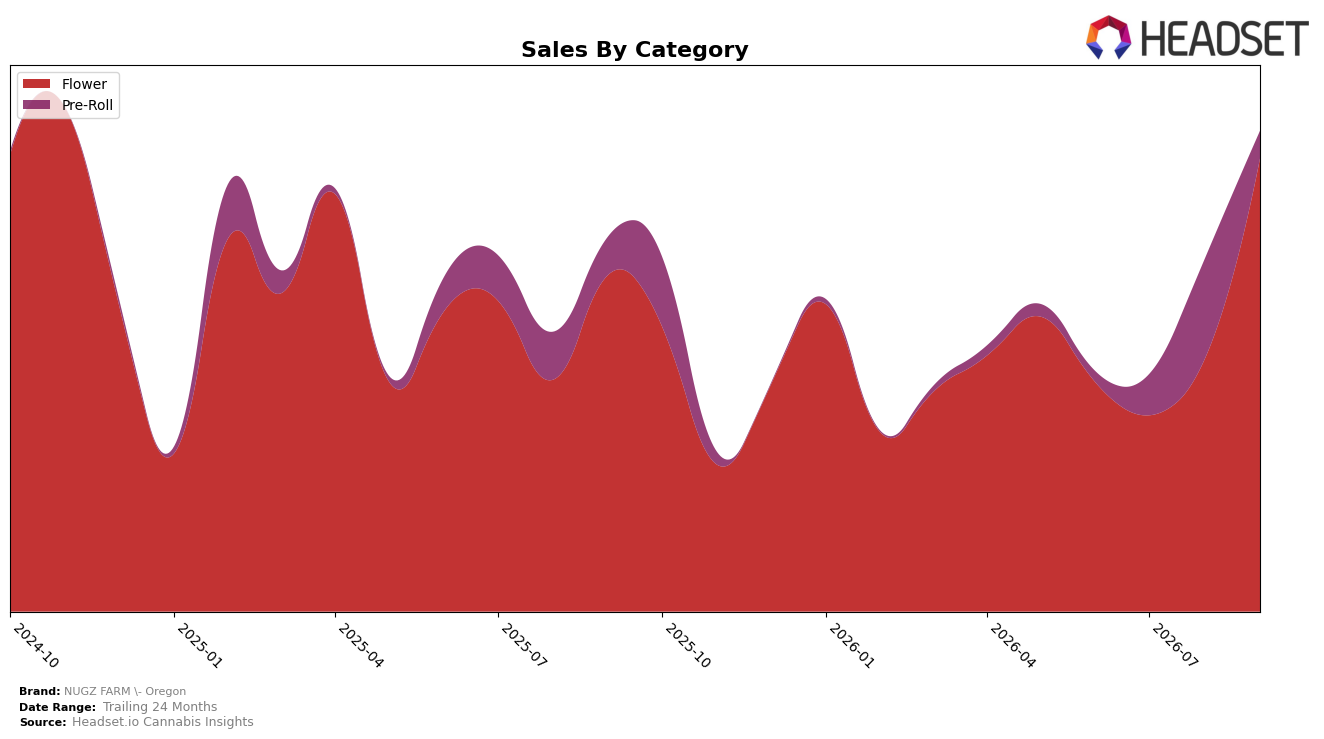
NUGZ FARM - Oregon concentrated 93.92% of September 2026 sales in Flower, up 34.36% year over year and 79.03% month over month, while Pre-Roll fell to 6.08% share with a 26.85% year-over-year decline and a 71.09% month-over-month drop. Average price fell 21.63% year over year to $21.29 even as total brand sales rose 27.85% year over year, implying volume-led gains rooted in Flower’s surge. Within Oregon, the category skew and simultaneous price compression indicate a deliberate pivot toward high-velocity Flower units over margin-rich Pre-Rolls, positioning September 2026 as a reallocation month toward scale.
Holding rank 23 in Oregon Flower alongside a 79.03% month-over-month Flower lift and a 71.09% month-over-month Pre-Roll contraction suggests a trade-up in competitive focus where share is attainable via volume and price elasticity. With Flower at 93.92% mix and average price down 21.63% year over year, the brand is signaling a price-to-win posture that can defend and potentially improve the rank 23 position, but the 26.85% year-over-year decline in Pre-Roll warns that over-reliance on one category may cap cross-category resilience; net effect is a strategy favoring Flower scale today to establish a base for selective re-entry into Pre-Roll once pricing stabilizes.
Competitive Landscape
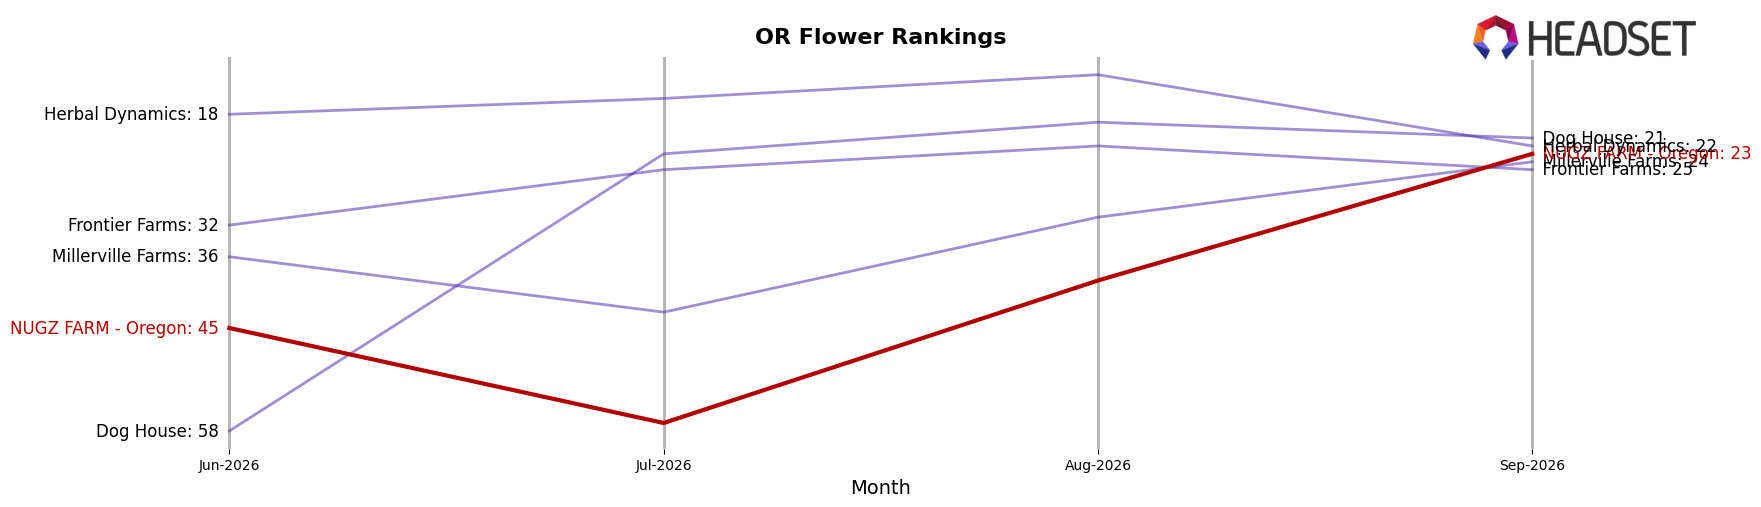
NUGZ FARM - Oregon sits at rank 23 in September 2026, a 4-position improvement from rank 27 year over year, and a 22-position climb from rank 45 in June 2026, indicating a recent acceleration toward its prior peak at rank 17 in November 2024. In contrast, Grown Rogue moved from rank 3 to rank 1 with 63.8% year-over-year sales growth, while Oregrown advanced from rank 16 to rank 3 on 169.7% year-over-year growth, positioning the competitive bar higher even as NUGZ FARM - Oregon narrows the gap. This combination of a 4-rank YoY gain and a 22-rank quarter-over-quarter surge implies a rebound trajectory that is gaining momentum but will require sustained share capture to convert into a return toward top-15 placement.
Notable Products
Pineapple Lemonade Pre-Roll (1g) posted the steepest decline in September 2026 with a -63.8% month-over-month drop and fell to rank 10, while Hog Wash (Bulk) also contracted by -50.6% and slipped to rank 4. Detroit Muscle (Bulk) held rank 1 with a stable lead over rank 2 and 3 entrants, indicating that pre-roll volatility contrasts with steadier Flower positioning; the pattern implies reliance on flagship Flower while pre-rolls introduce downside variance.
Four of the top ten are 1g Flower SKUs, and Blueberry Sugar (1g) declined by -49.5% at rank 9 while White Duck (1g) grew +23.0% at rank 6. The concentration in 1g units alongside opposing movements within the format suggests SKU-level cannibalization or uneven pull-through, implying that NUGZ FARM - Oregon should streamline 1g assortment while leaning into higher-ranked bulk and eighths to stabilize mix and margin.
Top Selling Cannabis Brands






Data for this report comes from real-time sales reporting by participating cannabis retailers via their point-of-sale systems, which are linked up with Headset’s business intelligence software. Headset’s data is very reliable, as it comes digitally direct from our partner retailers. However, the potential does exist for misreporting in the instance of duplicates, incorrectly classified products, inaccurate entry of products into point-of-sale systems, or even simple human error at the point of purchase. Thus, there is a slight margin of error to consider. Brands listed on this page are ranked in the top twenty within the market and product category by total retail sales volume.

