.svg)
Aug-2026
Sales
Trend
6-Month
Product Count
SKUs
Avg Price
YoY Sales Change
YoY Price Change


Where to Buy
Oregon Roots is stocked at 107 licensed dispensaries across Oregon, with the deepest coverage in Portland, Salem, Eugene, Medford, and Oregon City. Search by ZIP code or city below to find the closest one, or filter by product type if you are after a specific format.
Market Insights Snapshot
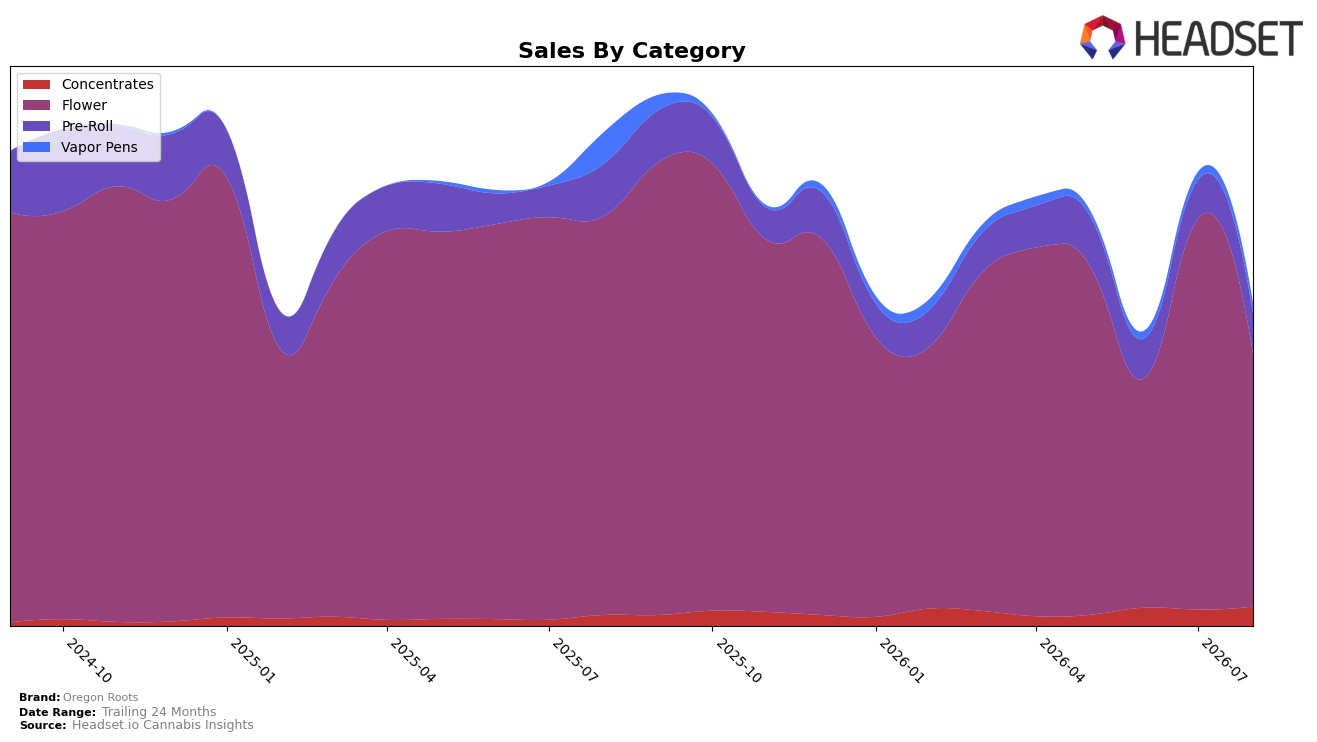
Oregon Roots concentrated 78.34% of August 2026 sales in Flower, where sales fell 36.90% year over year and 35.54% month over month, while Pre-Roll held 12.58% share with a 22.52% YoY decline but a 3.99% MoM gain. Smaller lines moved in opposite directions: Concentrates at 5.95% share rose 78.20% YoY and 18.18% MoM, and Vapor Pens at 3.13% share dropped 67.77% YoY yet jumped 31.91% MoM; with Flower ranked 27 in Oregon and an average price down 43.33% YoY to $7.94, the mix signals overexposure to a contracting core and a price-led defense that has not offset volume erosion.
The shift toward faster-growing sublines implies a gradual hedge against Flower volatility: Concentrates’ 78.20% YoY and 18.18% MoM gains, alongside Vapor Pens’ 31.91% MoM rebound despite a 67.77% YoY drop, indicates traction in higher-value formats even as Flower’s 36.90% YoY and 35.54% MoM declines cap overall momentum; with Pre-Roll’s 3.99% MoM increase against a 22.52% YoY slide, the portfolio is tilting to categories that can support mix-driven margin recovery if pricing normalizes from the 43.33% YoY average price reduction.
Competitive Landscape
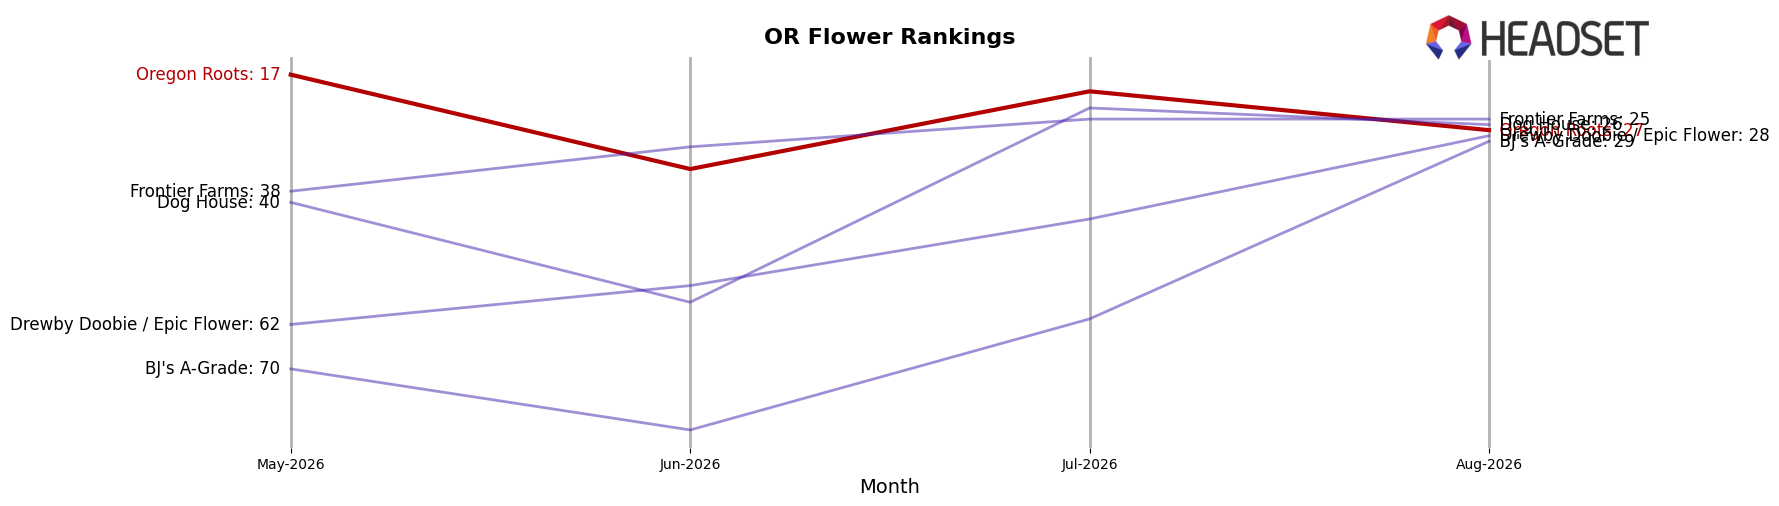
Oregon Roots sits at rank #27 in OR Flower in August 2026, down 12 spots year over year from #15, and 10 places below its May 2026 position of #17; this decline contrasts with Grown Rogue holding #1 while improving 2 ranks from #3 year over year, and Oregrown climbing from #23 to #3 as sales grew 182.4% year over year; with a prior peak of #9 in October 2025 and a current gap of 18 ranks from that peak, the multi-quarter slide alongside competitors’ upward moves implies Oregon Roots is losing relative velocity in the OR Flower leaderboard and must reverse share drift to avoid further rank erosion.
Notable Products
Alien Dreams (3.5g) posted the standout movement in August 2026 with a +64.5% month-over-month surge that propelled it to rank 2, while Grape Snow Train (7g) slipped 9.7% and still held rank 1. Strawberry OG (Bulk) fell 40.2% to rank 3 and Mo'Bama (1g) declined 18.7% at rank 4, indicating that gains are concentrated in a single packaged eighth while multiple Flower formats contracted. Four of the top ten SKUs are Pre-Rolls clustered at ranks 7–10 with no reported month-over-month change, suggesting a stable but secondary role versus Flower despite Holiday Special Pre-Roll (1g) generating $3,869. The pattern implies Oregon Roots is leaning into packaged Flower momentum while bulk and single-gram Flower softness signals mix volatility that could shift shelf focus toward high-velocity eighths.
Top Selling Cannabis Brands






Data for this report comes from real-time sales reporting by participating cannabis retailers via their point-of-sale systems, which are linked up with Headset’s business intelligence software. Headset’s data is very reliable, as it comes digitally direct from our partner retailers. However, the potential does exist for misreporting in the instance of duplicates, incorrectly classified products, inaccurate entry of products into point-of-sale systems, or even simple human error at the point of purchase. Thus, there is a slight margin of error to consider. Brands listed on this page are ranked in the top twenty within the market and product category by total retail sales volume.

