Market Insights Snapshot
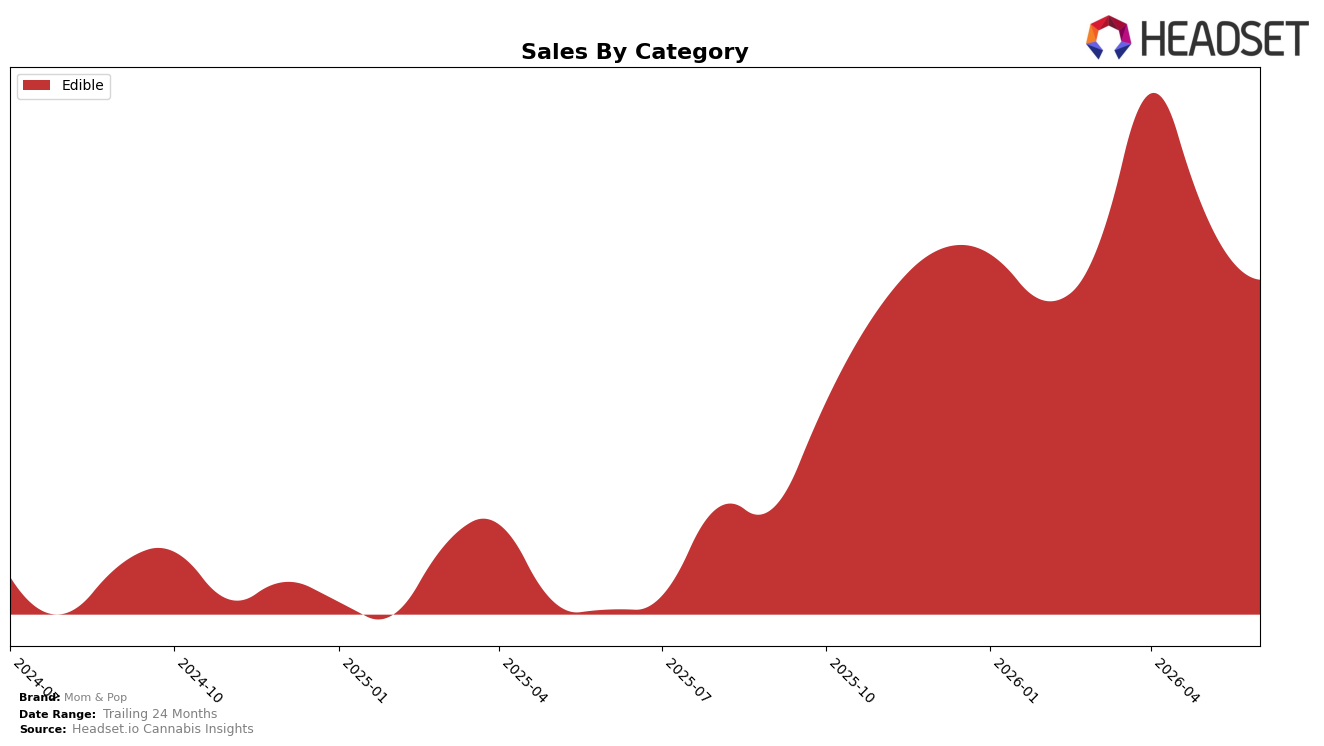
In June 2026, Mom & Pop’s category mix was concentrated entirely in Edible, with Edible holding 100.0% share and ranking 13th in Arizona while the month-over-month change registered -11.34% and the year-over-year change reached 165.12%. Against this backdrop, average price rose 44.20% year over year to $31.60, while brand sales expanded 165.12% year over year despite the single-category exposure. The pattern implies growth is riding a price-led, Edible-only strategy that improved annual standing but left month-over-month momentum negative, placing risk on sustained rank gains at 13 if price elasticity tightens.
The combination of a 100.0% Edible reliance and a -11.34% month-over-month dip, alongside a 44.20% price increase and a 165.12% annual sales rise, indicates positioning tied to premiumization rather than assortment breadth. With an Arizona Edible rank of 13 and 24-month brand growth of 104.06%, the mix suggests Mom & Pop is trading depth for focus: pricing is carrying volume on a yearly basis, but the single-category exposure raises volatility risk month to month. The implication is that maintaining or improving rank 13 will likely depend on either moderating price-led gains to stabilize monthly swings or selectively adding adjacent formats to buffer Edible-specific seasonality.
Competitive Landscape
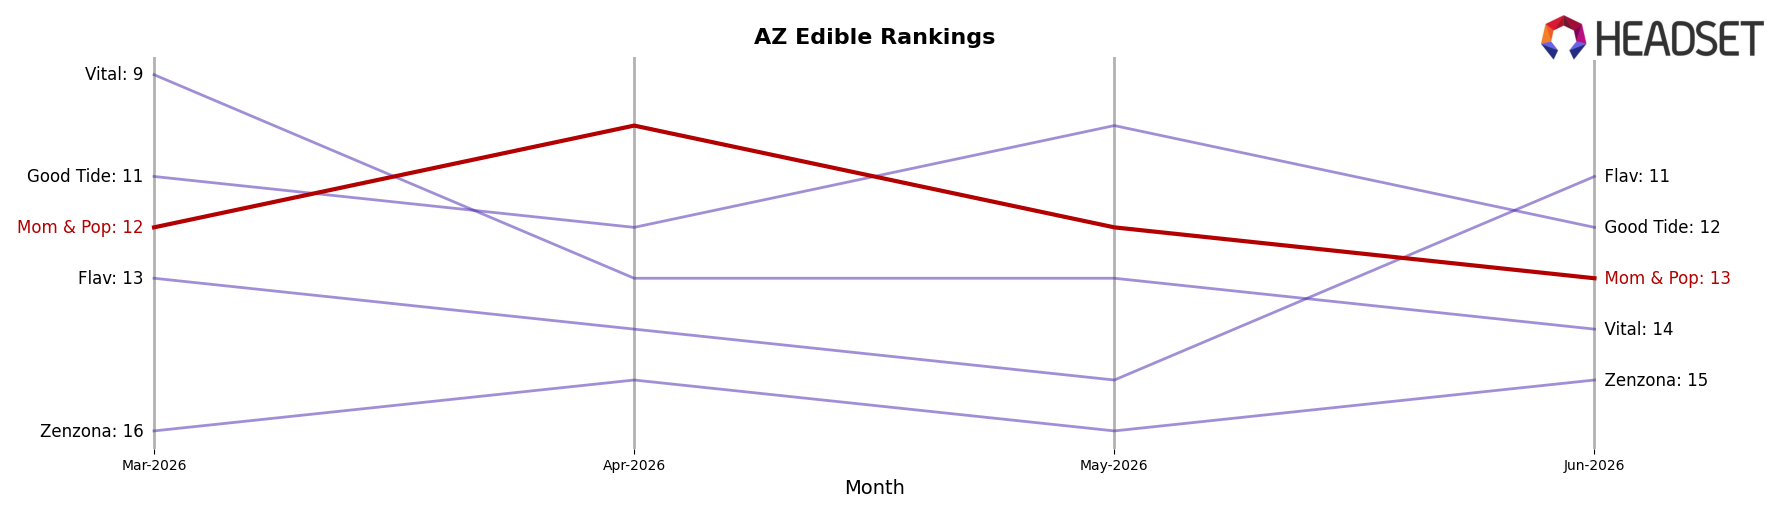
Mom & Pop sits at rank #13 in AZ Edible in June 2026, improving 8 positions year over year from #21, but softening 1 place versus March 2026 when it was #12; that trajectory follows a brief peak at #10 in April 2026, indicating a two-rank slide since that high-water mark. Among competitors, Wyld held #1 year over year and in June 2026 despite a -15.3% YoY sales change, while Baked Bros advanced from #4 to #3 alongside a 30.9% YoY sales increase; in contrast, OGEEZ maintained #2 with a 15.1% YoY lift while Gron / Grön slipped from #3 to #4 even with a 7.6% YoY gain. The pattern implies that Mom & Pop’s YoY climb in rank masks recent quarter-over-quarter pressure, and sustaining share will require converting the April 2026 peak into durable placement against competitors posting double-digit YoY gains.
Notable Products
Strawberry Gummies 20-Pack (2000mg) posted the largest month-over-month gain at +63.5% and climbed to rank 4, while Strawberry Gummy 10-Pack (2000mg) fell -10.7% but held rank 1; this divergence within the same flavor suggests upsizing is converting existing buyers rather than expanding flavor demand. Mixed Berry Gummy 10-Pack (2000mg) dropped -23.1% at rank 2 and Watermelon Gummy 10-Pack (2000mg) slid -14.6% at rank 3, yet Milk Chocolate Bar Single (1000mg) grew +11.4% at rank 6, indicating gummies remain dominant even as chocolate stabilizes basket value around $15.3k. Six of the top ten are Edible gummy SKUs, concentrating share in a single format even as the THC/CBN 2:1 Sleep Dark Chocolate Bar 10-Pack (100mg THC, 50mg CBN) declined -27.6% at rank 8, which points to functional niche softness versus core candy formats. The product mix implies Mom & Pop is leaning into higher-count gummy packs and classic flavors to protect rank leadership while treating chocolate as a margin-supporting secondary lane rather than a growth engine.
Top Selling Cannabis Brands
Data for this report comes from real-time sales reporting by participating cannabis retailers via their point-of-sale systems, which are linked up with Headset’s business intelligence software. Headset’s data is very reliable, as it comes digitally direct from our partner retailers. However, the potential does exist for misreporting in the instance of duplicates, incorrectly classified products, inaccurate entry of products into point-of-sale systems, or even simple human error at the point of purchase. Thus, there is a slight margin of error to consider. Brands listed on this page are ranked in the top twenty within the market and product category by total retail sales volume.

