.svg)

Sep-2026
Sales
Trend
6-Month
Product Count
SKUs
Avg Price
YoY Sales Change
YoY Price Change


Where to Buy
Grow Sciences is stocked at 174 licensed dispensaries across Illinois, Arizona, and New Jersey, 92 of them in Illinois, with the deepest coverage in Chicago, Joliet, Springfield, Champaign, and Danville. Search by ZIP code or city below to find the closest one, or filter by product type if you are after a specific format.
Market Insights Snapshot
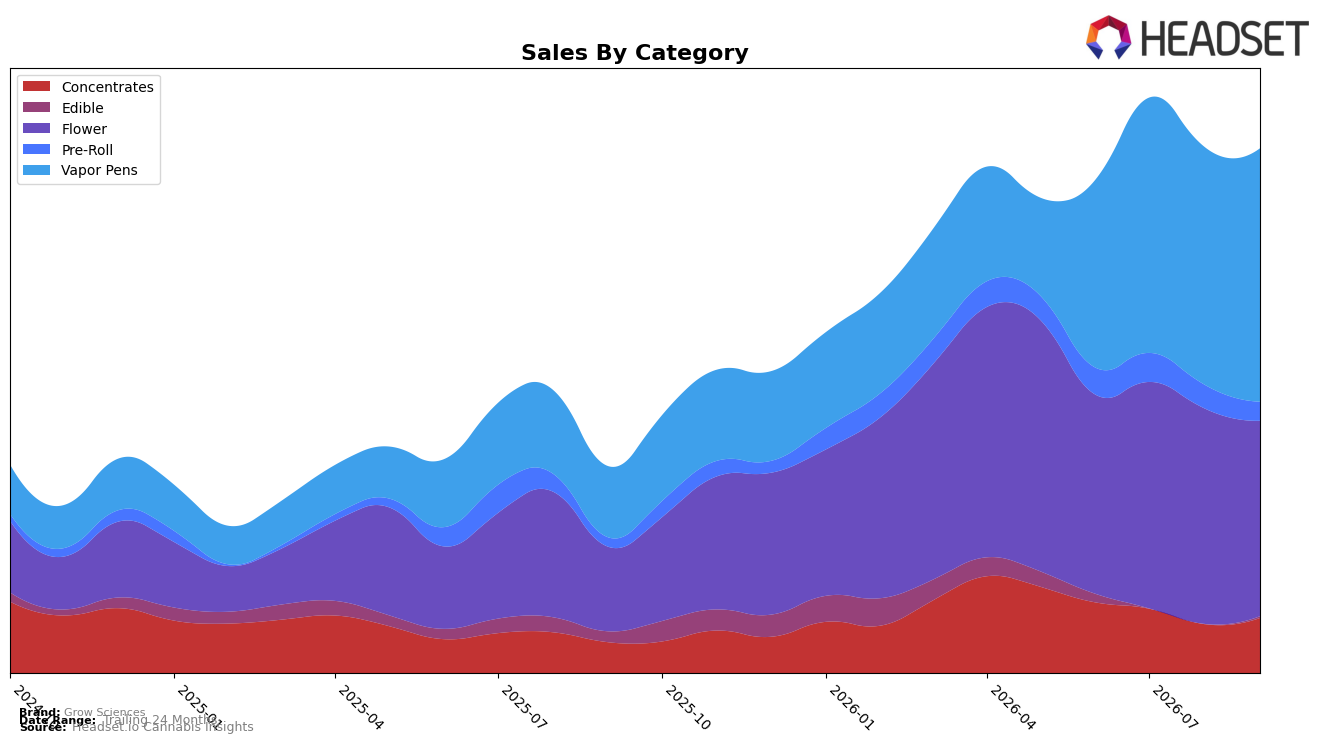
In September 2026, Vapor Pens held 47.53% share with 245.82% year-over-year growth and 6.51% month-over-month, while Flower at 36.78% share rose 126.81% YoY but fell 9.16% MoM; Concentrates reached 10.75% share with 71.97% YoY and 11.96% MoM, and Pre-Roll slid to 4.08% share despite 78.50% YoY due to a 17.50% MoM drop. Edible was 0.87% share with a 66.13% YoY decline but a 48.30% MoM rebound, and the brand’s average price fell 4.54% YoY to $26.27 while Vapor Pens’ average price sat higher at $31.70, indicating the growth mix is tilting toward a higher-priced anchor even as overall pricing softens. The pattern implies Grow Sciences is concentrating demand into Vapor Pens and Concentrates for September 2026, using lower average pricing year-over-year to expand volume while allowing premium-priced Vapor Pens to carry mix-led revenue gains.
With Vapor Pens ranking 7 in Arizona and holding 47.53% of brand sales, the simultaneous 6.51% MoM growth in that category and 9.16% MoM pullback in Flower suggests a deliberate pivot toward inhalable convenience that can scale faster than bulk Flower. The 11.96% MoM upswing in Concentrates alongside a 17.50% MoM contraction in Pre-Roll reallocates share toward categories where premiumization (Vapor Pens average price $31.70) can offset the 4.54% YoY decline in overall average price, implying a price-pack architecture designed to win rank in Vapor Pens while accepting tactical softness in Flower and Pre-Roll to reinforce a top-10 position in Arizona.
Competitive Landscape
Grow Sciences sits at rank #7 in AZ Vapor Pens in September 2026, improving 6 positions year over year from #13 and advancing 3 spots since June 2026 from #10, reaching a new peak rank of #7 in September 2026; by comparison, Mfused held steady at #1 year over year while Abstrakt climbed from #5 to #2 alongside a 133.9% YoY sales lift, and Timeless moved from #6 to #5 with a 22.7% YoY increase. This simultaneous upward pressure from rivals at #1, #2, and #5, paired with Grow Sciences’ fastest three-month gain of 3 ranks into its September 2026 peak, implies a momentum phase that is closing the gap on the mid-tier but will require sustained share capture to break into the top five.

Notable Products
Hashburger (3.7g) posted the steepest decline at -58.6% month over month, sliding to rank 5, while Prickly Pear (3.7g) also fell -13.0% to rank 6; in contrast, BlinQr - Candy Apple Distillate Disposable (2g) rose +22.8% to rank 1 with $80,417 in September 2026. Across the top ten, four placements are Flower SKUs versus four Vapor Pens, but the highest positions skew to Vapor Pens with Jungle Juice Live Resin Disposable (2g) at rank 2 (+3.8%) and BlinQr - Tropical Vacation Distillate Disposable (2g) at rank 4 (-2.7%). The dispersion—double-digit declines in two Flower SKUs alongside incremental gains for leading pens—implies Grow Sciences is pivoting shelf momentum toward disposables while Flower volatility pressures mix stability.
Top Selling Cannabis Brands






Data for this report comes from real-time sales reporting by participating cannabis retailers via their point-of-sale systems, which are linked up with Headset’s business intelligence software. Headset’s data is very reliable, as it comes digitally direct from our partner retailers. However, the potential does exist for misreporting in the instance of duplicates, incorrectly classified products, inaccurate entry of products into point-of-sale systems, or even simple human error at the point of purchase. Thus, there is a slight margin of error to consider. Brands listed on this page are ranked in the top twenty within the market and product category by total retail sales volume.

