Jun-2026
Sales
Trend
6-Month
Product Count
SKUs
Avg Price
YoY Sales Change
YoY Price Change
Market Insights Snapshot
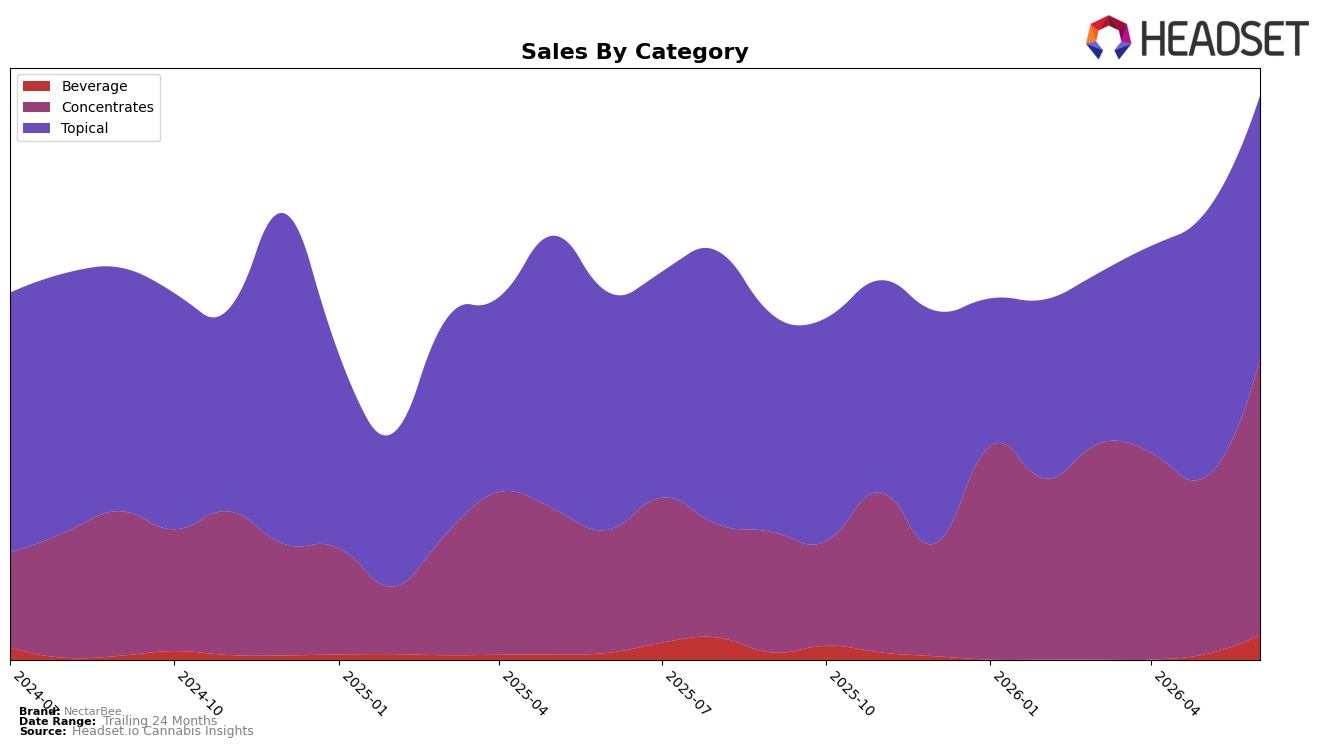
NectarBee’s mix in June 2026 is concentrated in two categories: Concentrates at 48.97% share and Topical at 46.66% share, with Beverage at 4.37%. Concentrates expanded sharply with 124.57% year-over-year growth and 56.18% month-over-month, while Topical grew 10.84% YoY but slipped 0.35% MoM. Beverage, though small, spiked 260.83% YoY and 370.88% MoM. With brand-level sales up 53.57% YoY and average price down 14.61%, the pattern implies volume-led expansion anchored by Concentrates, an incremental Beverage test gaining traction, and mild Topical softness that tempers near-term mix stability.
Positioning-wise, the 56.18% MoM surge in Concentrates alongside a 370.88% MoM Beverage jump suggests a tilt toward potency-driven formats and entry-price occasions simultaneously, while the 0.35% MoM dip in Topical indicates limited elasticity support at a $19.56 average price versus $15.48 in Concentrates. Holding 48.97% mix in Concentrates while ranking 47 in Colorado Concentrates signals under-penetration versus peers despite fast internal growth, meaning the path to sustained share likely depends on converting the recent month-over-month trial into repeat in Concentrates and deciding whether the 4.37% Beverage slice remains a tactical traffic driver or scales into a strategic third pillar.
Competitive Landscape
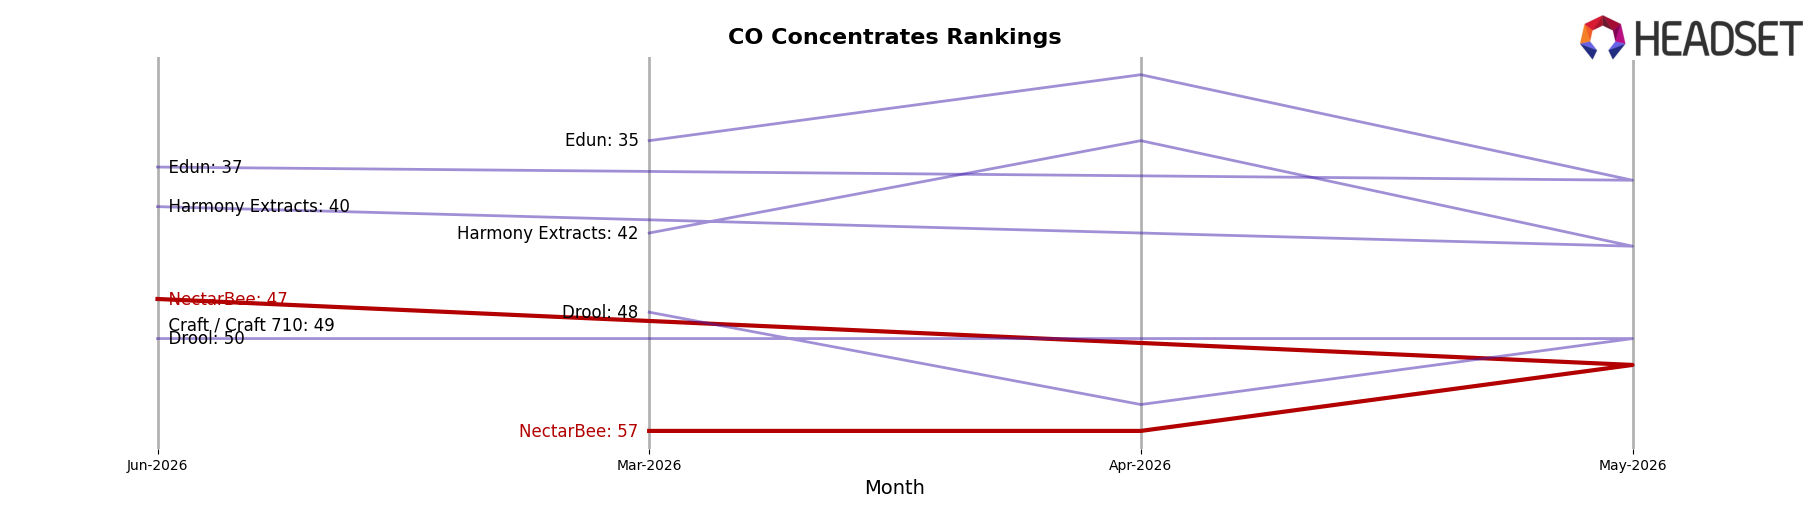
NectarBee sits at rank #47 in CO Concentrates in June 2026, improving 23 positions from #70 year over year and rising 10 spots from #57 since March 2026; this marks a peak rank of #47 in June 2026 alongside a category top tier where Amber held #1 both year over year and in June 2026 while growing sales by 39.0%, and 710 Labs held #2 with a -9.9% sales change yet still outpaced NectarBee on placement. Compared with Nomad Extracts climbing from #5 to #3 and gaining 18.1% in sales, NectarBee’s 23-rank YoY lift into #47 without breaching the top 40 indicates momentum concentrated in the mid-tier rather than displacement of leaders; the trajectory implies continued share recovery but with a ceiling unless conversion accelerates fast enough to close a 44-rank gap to the podium.
Notable Products
Ginger Ale (10mg, 355ml) surged 370.2% month over month in June 2026 to reach rank 4, while Pure Caviar (1g) climbed 56.2% to hold rank 1. Two of the top four SKUs are Topical products at ranks 2 and 3, yet the CBD/THC 1:1 Heal Line Muscle Balm (100mg CBD, 100mg THC) slipped 5.4% as the CBD/THC 1:5 Heal Line Nerve Salve (50mg CBD, 250mg THC, 1.78oz) rose 8.1%. This pattern implies shifting incremental demand toward high-velocity novelty formats, with Concentrates anchoring share at the top while Beverage tests outsized elasticity.
Top Selling Cannabis Brands
Data for this report comes from real-time sales reporting by participating cannabis retailers via their point-of-sale systems, which are linked up with Headset’s business intelligence software. Headset’s data is very reliable, as it comes digitally direct from our partner retailers. However, the potential does exist for misreporting in the instance of duplicates, incorrectly classified products, inaccurate entry of products into point-of-sale systems, or even simple human error at the point of purchase. Thus, there is a slight margin of error to consider. Brands listed on this page are ranked in the top twenty within the market and product category by total retail sales volume.

