.svg)

Sep-2026
Sales
Trend
6-Month
Product Count
SKUs
Avg Price
YoY Sales Change
YoY Price Change


Where to Buy
Nomad Extracts is stocked at 125 licensed dispensaries across Colorado, Missouri, and 4 other states, 99 of them in Colorado, with the deepest coverage in Denver, Colorado Springs, Boulder, Grand Junction, and Durango. Search by ZIP code or city below to find the closest one, or filter by product type if you are after a specific format.
Market Insights Snapshot
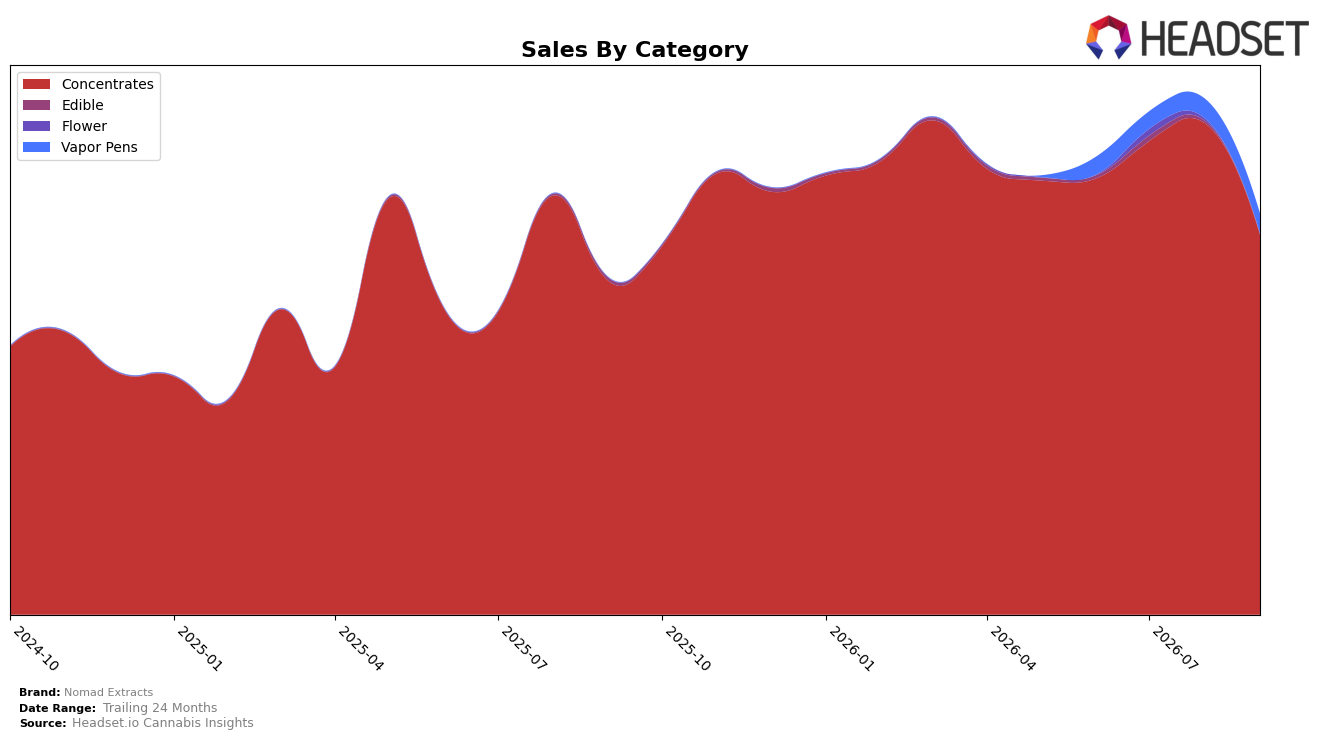
Nomad Extracts concentrated its September 2026 mix in Concentrates at 94.97% share, with that category up 13.79% year over year but down 22.75% month over month, while Vapor Pens held 4.90% share with a 1.65% MoM increase and Edible fell to 0.12% share with an 81.17% YoY decline. Average price slipped 3.00% YoY to $17.33 as Concentrates priced at $16.88 and Vapor Pens at $44.92, and in Colorado Concentrates the brand sat at rank 3, framing the category-heavy exposure against a modest MoM uplift in pens. The pattern implies a Concentrates-centric portfolio that is vulnerable to monthly volatility from a single category while still compounding YoY gains through depth in its lead segment.
Holding rank 3 in Colorado Concentrates while Concentrates fell 22.75% MoM but rose 13.79% YoY, and while Vapor Pens edged up 1.65% MoM, indicates position is anchored in Concentrates but benefits from small counter-cyclical support from pens. With overall brand sales up 18.87% YoY alongside a 3.00% YoY price reduction and a 0.12% Edible share after a 76.38% MoM contraction, the mix signals a value-leaning Concentrates strategy that trades price for velocity and uses a narrow pen presence to smooth month-to-month swings, implying further stability will depend on either expanding pens beyond ~5% share or reducing Concentrates’ >90% concentration risk.
Competitive Landscape
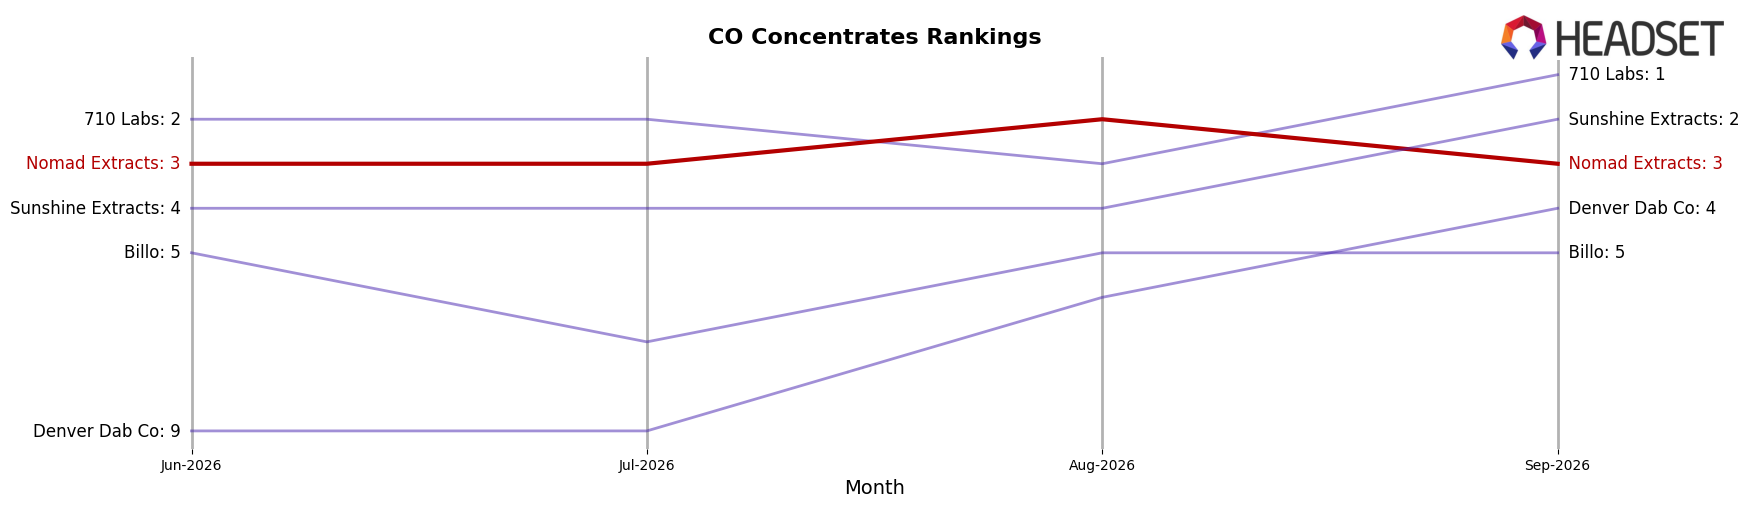
Nomad Extracts sits at rank #3 in CO Concentrates in September 2026, unchanged versus September 2025 at #3, and holding the same #3 position from June 2026 while having peaked at #2 in August 2026; meanwhile, 710 Labs is #1 after sliding from #2 year over year with a −18.6% sales change, and Sunshine Extracts moved up to #2 from #6 year over year with +49.9% sales growth; compared with Denver Dab Co at #4 (up from #8, +56.8%), Nomad Extracts’ flat rank at #3 despite a one-month peak to #2 indicates stable mid-top placement but rising pressure from faster climbers immediately above and below.
Notable Products
Kevin Garnett Wax (1g) posted the steepest shift in September 2026 with a -13.5% month-over-month decline while holding rank 4, contrasting with Slazerbeam Shatter (1g) up 37.7% at rank 3. Apricot Haze Sugar Wax (1g) climbed 19.6% to remain at rank 1, and Mango Mentality Sugar Wax (1g) advanced 23.8% at rank 2, indicating upward pull from the top three despite Grandpa's Stash Shatter (1g) sliding -19.6% at rank 8. Eight of the top ten are Concentrates SKUs in sugar wax or shatter formats, and the top spot generated $8.5k, implying Nomad Extracts is consolidating around fast-moving Concentrates while pruning underperforming shatter variants.
Top Selling Cannabis Brands






Data for this report comes from real-time sales reporting by participating cannabis retailers via their point-of-sale systems, which are linked up with Headset’s business intelligence software. Headset’s data is very reliable, as it comes digitally direct from our partner retailers. However, the potential does exist for misreporting in the instance of duplicates, incorrectly classified products, inaccurate entry of products into point-of-sale systems, or even simple human error at the point of purchase. Thus, there is a slight margin of error to consider. Brands listed on this page are ranked in the top twenty within the market and product category by total retail sales volume.

